High levels of public uncertainty about which economic policies a country will adopt can make planning difficult for businesses, but...
GMAT Information and Ideas : (Ideas) Questions
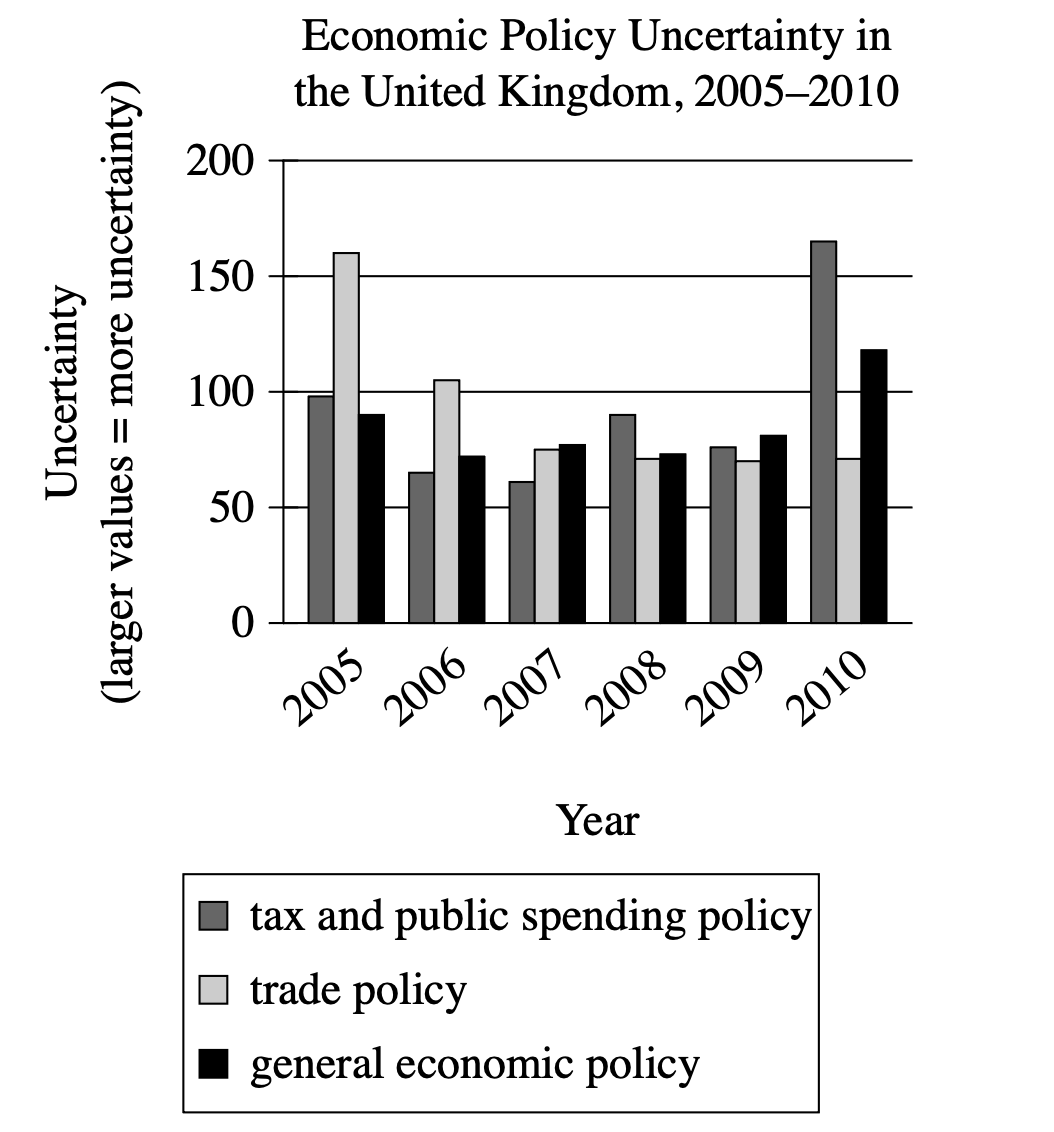
High levels of public uncertainty about which economic policies a country will adopt can make planning difficult for businesses, but measures of such uncertainty have not tended to be very detailed. Recently, however, economist Sandile Hlatshwayo analyzed trends in news reports to derive measures not only for general economic policy uncertainty but also for uncertainty related to specific areas of economic policy, like tax or trade policy. One revelation of her work is that a general measure may not fully reflect uncertainty about specific areas of policy, as in the case of the United Kingdom, where general economic policy uncertainty __________
Which choice most effectively uses data from the graph to illustrate the claim?
aligned closely with uncertainty about tax and public spending policy in 2005 but differed from uncertainty about tax and public spending policy by a large amount in 2009.
was substantially lower than uncertainty about tax and public spending policy each year from 2005 to 2010.
reached its highest level between 2005 and 2010 in the same year that uncertainty about trade policy and tax and public spending policy reached their lowest levels.
was substantially lower than uncertainty about trade policy in 2005 and substantially higher than uncertainty about trade policy in 2010.
Step 1: Decode and Map All Source Material
Part A: Passage Analysis Table
| Text from Passage | Analysis |
|---|---|
| 'High levels of public uncertainty about which economic policies a country will adopt can make planning difficult for businesses, but measures of such uncertainty have not tended to be very detailed.' |
|
| 'Recently, however, economist Sandile Hlatshwayo analyzed trends in news reports to derive measures not only for general economic policy uncertainty but also for uncertainty related to specific areas of economic policy, like tax or trade policy.' |
|
| 'One revelation of her work is that a general measure may not fully reflect uncertainty about specific areas of policy, as in the case of the United Kingdom, where general economic policy uncertainty ______' |
|
Visual Data Analysis
Visual Type: Bar chart showing Economic Policy Uncertainty in the United Kingdom, 2005-2010
What It Shows: Three types of uncertainty (Tax/public spending, Trade policy, General economic) measured annually from 2005-2010. Higher values indicate more uncertainty.
Key Observations: In 2005, trade policy uncertainty was highest at about 160, while general economic uncertainty was lowest at about 85. By 2010, this relationship flipped with general uncertainty at about 120 and trade uncertainty dropping to about 70. Tax/spending uncertainty spiked dramatically in 2010 to about 170.
Part B: Passage Architecture
Main Point: Hlatshwayo discovered that general economic policy uncertainty measures do not necessarily reflect uncertainty about specific policy areas.
Text-Visual Connection: The passage establishes that general and specific uncertainty measures can differ, while the graph provides UK data showing how these measures diverged over time.
Step 2: Interpret the Question Precisely
This is a fill-in-the-blank question asking us to choose the best logical connector. The answer must create the right relationship between what comes before and after the blank.
Step 3: Prethink the Answer
- The correct answer should use specific data points from the graph to show how general uncertainty behaved differently from specific policy uncertainties, demonstrating they do not track together
aligned closely with uncertainty about tax and public spending policy in 2005 but differed from uncertainty about tax and public spending policy by a large amount in 2009.
✗ Incorrect
- Claims general and tax/spending were close in 2005 but differed greatly in 2009
- Graph shows they were actually close in both years, contradicting the claim
was substantially lower than uncertainty about tax and public spending policy each year from 2005 to 2010.
✗ Incorrect
- Claims general was substantially lower than tax/spending every year
- Graph shows general was actually higher in several years (2006, 2007, 2009)
reached its highest level between 2005 and 2010 in the same year that uncertainty about trade policy and tax and public spending policy reached their lowest levels.
✗ Incorrect
- Claims general peaked when both trade and tax/spending hit their lowest levels in the same year
- Graph shows trade was lowest in 2010 but tax/spending was lowest around 2007, not the same year
was substantially lower than uncertainty about trade policy in 2005 and substantially higher than uncertainty about trade policy in 2010.
✓ Correct
- States general was substantially lower than trade in 2005 and substantially higher than trade in 2010
- Graph confirms: 2005 general \(\mathrm{(85)}\) vs trade \(\mathrm{(160)}\) and 2010 general \(\mathrm{(120)}\) vs trade \(\mathrm{(70)}\)
- This perfectly illustrates how general uncertainty diverged from specific policy areas