In 2021, four of the United States national parks that were among the most visited were Grand Canyon National Park,...
GMAT Information and Ideas : (Ideas) Questions
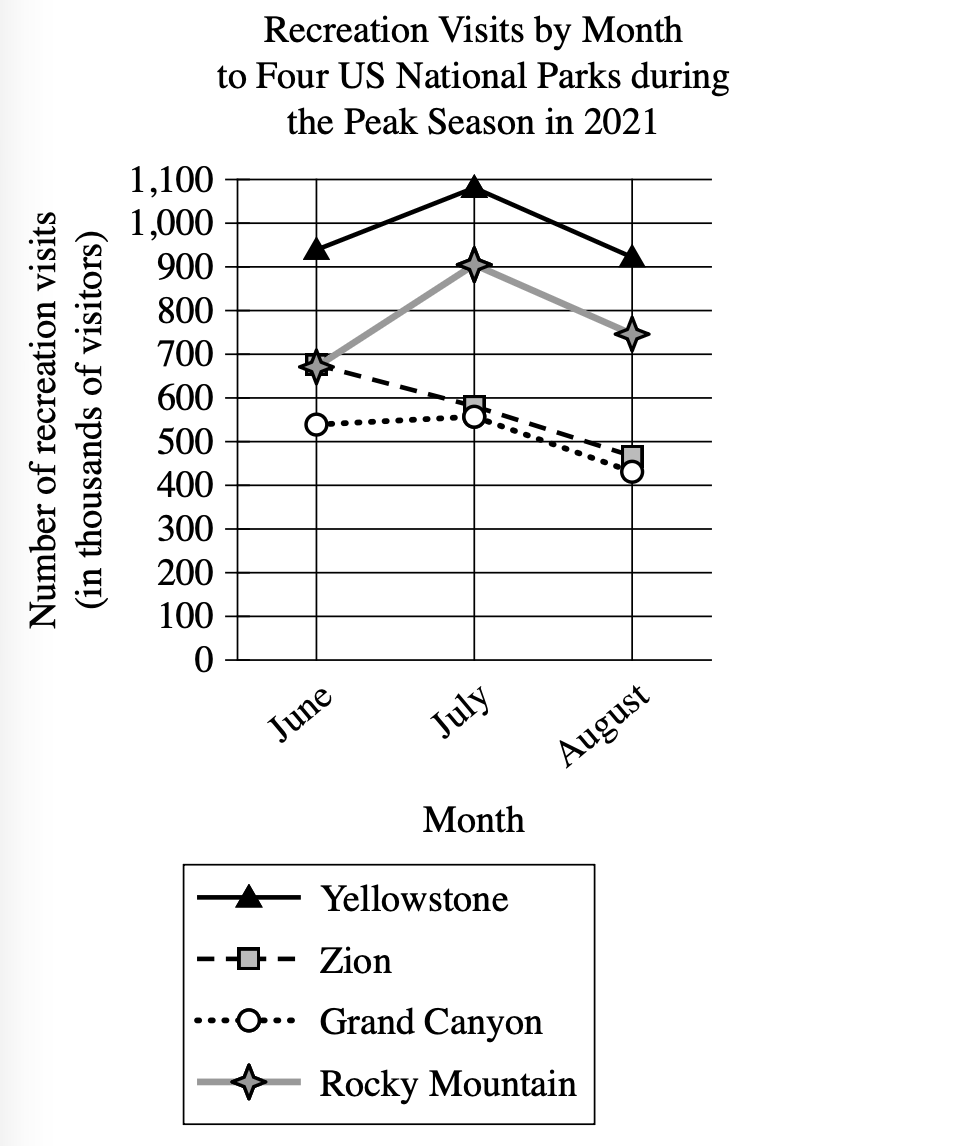
In 2021, four of the United States national parks that were among the most visited were Grand Canyon National Park, Rocky Mountain National Park, Yellowstone National Park, and Zion National Park. The graph shows the number of visits for recreation to each of these parks during the three-month period with the highest number of visitors. A student notes that among the parks shown in the graph, the park with the highest monthly recreation visits in all three months was ______________
Which choice most effectively uses data from the graph to complete the text?
Zion National Park.
Rocky Mountain National Park.
Yellowstone National Park.
Grand Canyon National Park.
Step 1: Decode and Map All Source Material
Passage Analysis Table
| Text from Passage | Analysis |
|---|---|
| "In 2021, four of the United States national parks that were among the most visited were Grand Canyon National Park, Rocky Mountain National Park, Yellowstone National Park, and Zion National Park." |
|
| "The graph shows the number of visits for recreation to each of these parks during the three-month period with the highest number of visitors." |
|
| "A student notes that among the parks shown in the graph, the park with the highest monthly recreation visits in all three months was ______" |
|
Visual Data Analysis
Visual Type & Title: Line graph titled "Recreation Visits by Month to Four US National Parks during the Peak Season in 2021"
What It Shows: (Note format)
- X-axis: Months (June, July, August)
- Y-axis: Number of recreation visits (thousands of visitors)
- Four parks tracked: Yellowstone, Zion, Grand Canyon, Rocky Mountain
- Peak summer season data for 2021
Key Observations: (Note format)
- Yellowstone: June ~950K → July ~1,080K (peak) → August ~920K
- Rocky Mountain: June ~680K → July ~900K → August ~750K
- Zion: June ~680K → July ~580K → August ~470K (declining trend)
- Grand Canyon: June ~540K → July ~560K → August ~420K
- Yellowstone exceeds all others in all 3 months
- July = peak month for most parks
Step 2: Interpret the Question Precisely
What's being asked? We need to identify which national park had the highest number of recreation visits in June, July, AND August 2021.
What type of answer do we need? The name of the specific national park that topped the others in all three months.
Any limiting keywords? The key constraint is "in all three months"—this means the park must have been #1 in June, #1 in July, and #1 in August. It's not asking for the park with the highest total or average, but the one that was consistently the top performer each month.
Question Characterization
Content Genre: Sciences
Content Format: Text + Chart/Graph
Question Type: Simple Inference
Language Complexity: Accessible
Step 3: Prethink the Answer
- From the graph analysis, I need to identify which park had the highest visits in each individual month:
- June rankings: Which park has the highest point?
- July rankings: Which park has the highest point?
- August rankings: Which park has the highest point?
- The correct answer must be the park that ranked #1 in all three months. Looking at the graph data, Yellowstone has the highest line position in June (~950K), peaks highest in July (~1,080K), and remains highest in August (~920K), while the other parks all fall below Yellowstone's line in each month.
Zion National Park.
✗ Incorrect
- Zion shows a declining trend across the three months (680K→580K→470K) and never reaches the highest position in any of the three months.
Rocky Mountain National Park.
✗ Incorrect
- While Rocky Mountain has strong numbers (peaks at ~900K in July), it never surpasses Yellowstone in any month. Students might choose this because Rocky Mountain shows growth, but the question requires being #1 in ALL months.
Yellowstone National Park.
✓ Correct
- Graph data shows Yellowstone at ~950K (June), ~1,080K (July), ~920K (August). Maintains the highest position above all other parks in every single month, matching the requirement of "highest monthly recreation visits in all three months."
Grand Canyon National Park.
✗ Incorrect
- Shows the lowest numbers among all four parks in each month (June ~540K, July ~560K, August ~420K) and ranks last in the comparison across all three months.