In a study of urban physical expansion, Richa Mahtta et al. conducted a meta-analysis of more than 300 cities worldwide...
GMAT Information and Ideas : (Ideas) Questions
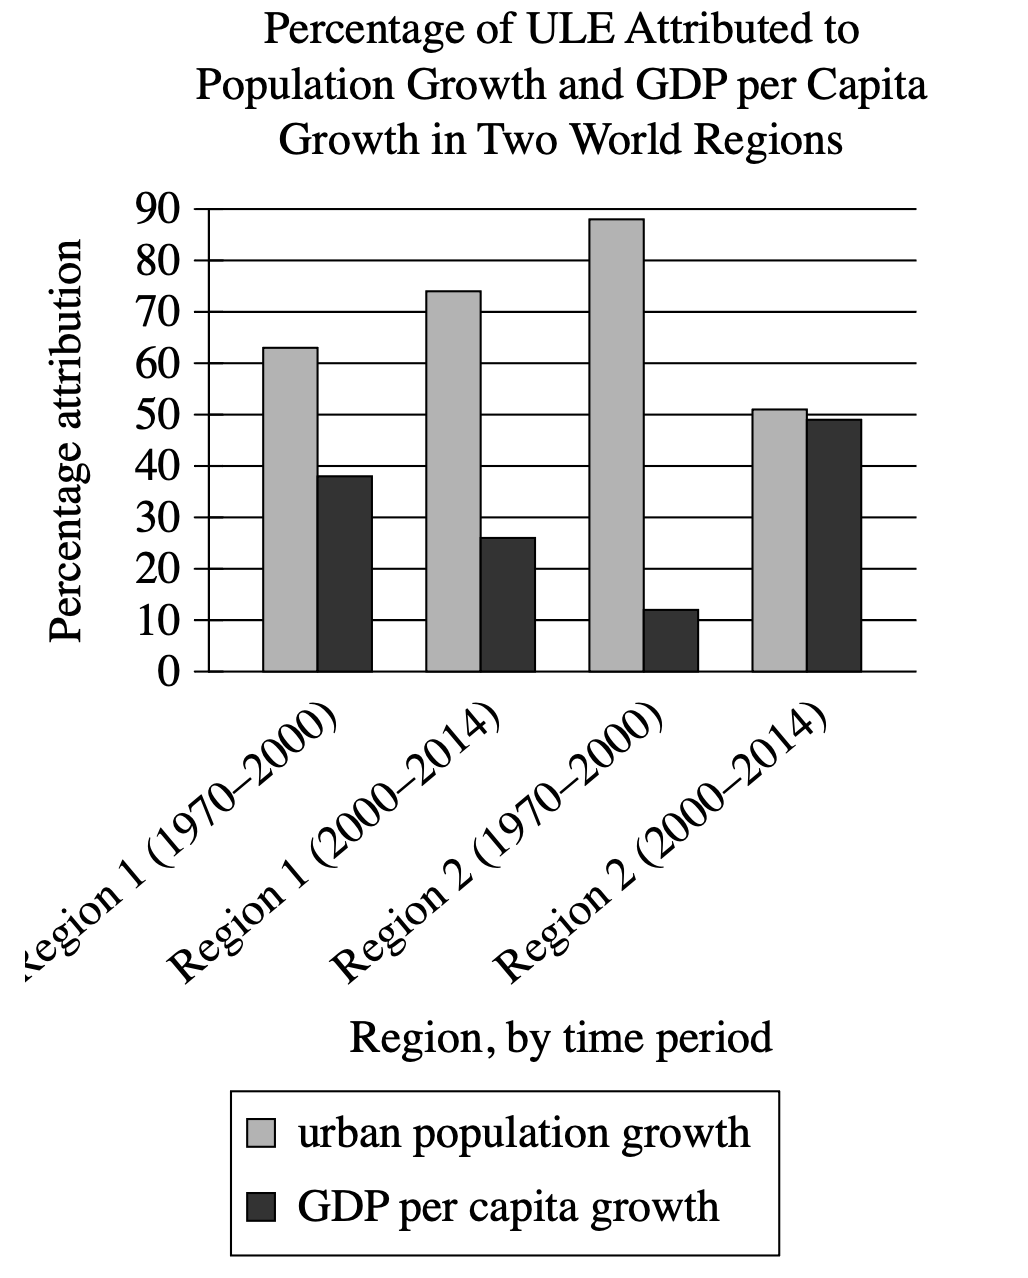
In a study of urban physical expansion, Richa Mahtta et al. conducted a meta-analysis of more than 300 cities worldwide to determine whether urban land expansion (ULE) was more strongly influenced by urban population growth or by growth in gross domestic product (GDP) per capita, a measure of economic activity. Because efficient national government is necessary to provide urban services and infrastructure that attract economic investment, Mahtta et al. propose that absent other factors, the importance of GDP per capita growth to ULE would likely increase relative to the importance of population growth as governments become more efficient. If true, this suggests the possibility that ______
Which choice most effectively uses data from the graph to complete the statement?
national governments of countries in Region 1 experienced declines in efficiency in the period from 2000 to 2014, relative to the period from 1970 to 2000.
countries in Region 1 experienced a slower rate of economic growth in the period from 2000 to 2014 than countries in Region 2 did, despite increasing national government efficiency in Region 1.
national governments of most countries in Region 2 became more efficient in the period from 2000 to 2014 than they had been in the period from 1970 to 2000, but those of several countries in this region did not.
national governments of countries in Region 1 and in Region 2 generally became more efficient in the period from 2000 to 2014 than they had been in the period from 1970 to 2000, but at different rates.
Step 1: Decode and Map the Passage
Passage Analysis Table
| Text from Passage | Analysis |
|---|---|
| "In a study of urban physical expansion, Richa Mahtta et al. conducted a meta-analysis of more than 300 cities worldwide to determine whether urban land expansion (ULE) was more strongly influenced by urban population growth or by growth in gross domestic product (GDP) per capita, a measure of economic activity." |
|
| "Because efficient national government is necessary to provide urban services and infrastructure that attract economic investment, Mahtta et al. propose that absent other factors, the importance of GDP per capita growth to ULE would likely increase relative to the importance of population growth as governments become more efficient." |
|
| "If true, this suggests the possibility that ______" |
|
Visual Data Analysis
Visual Type & Title: Bar chart - "Percentage of ULE Attributed to Population Growth and GDP per Capita Growth in Two World Regions"
What It Shows:
- Variables: % ULE attributed to urban pop growth (gray bars) vs GDP per capita growth (black bars)
- Regions: Region 1 & Region 2
- Time periods: 1970-2000 vs 2000-2014
- Key data points:
- Region 1 (1970-2000): Pop ~63%, GDP ~38%
- Region 1 (2000-2014): Pop ~75%, GDP ~26%
- Region 2 (1970-2000): Pop ~88%, GDP ~12%
- Region 2 (2000-2014): Pop ~50%, GDP ~49%
Key Observations:
- Region 1: GDP importance decreased (38% to 26%) over time
- Region 2: GDP importance increased dramatically (12% to 49%) over time
- Region 1: Pop growth became MORE dominant
- Region 2: Pop vs GDP became nearly equal
Passage Architecture & Core Elements
Main Point: Researchers theorize that more efficient governments should make GDP per capita growth increasingly important relative to population growth in driving urban land expansion.
Argument Flow: The passage establishes a research question about factors driving urban expansion, presents a theoretical relationship between government efficiency and the relative importance of economic vs. demographic factors, then asks us to infer what this theory suggests based on empirical data.
Step 2: Interpret the Question Precisely
This is a fill-in-the-blank question asking us to choose the best logical connector. The answer must create the right relationship between what comes before and after the blank.
Step 3: Prethink the Answer
- According to the theory, when governments become MORE efficient, GDP per capita should become MORE important relative to population growth for ULE. Conversely, when governments become LESS efficient, GDP per capita should become LESS important.
- Looking at the graph data:
- Region 1: GDP importance decreased from ~38% to ~26% (became less important)
- Region 2: GDP importance increased dramatically from ~12% to ~49% (became much more important)
- Using the theory to interpret this data:
- Region 1 pattern suggests government efficiency DECREASED (because GDP became less important)
- Region 2 pattern suggests government efficiency INCREASED (because GDP became much more important)
- So the right answer should recognize that Region 1's data pattern - where GDP per capita became less important over time - suggests declining government efficiency in that region.
national governments of countries in Region 1 experienced declines in efficiency in the period from 2000 to 2014, relative to the period from 1970 to 2000.
- Directly matches the graph data showing GDP per capita importance in Region 1 decreased from ~38% to ~26%
- Correctly applies Mahtta et al.'s theory: if GDP becomes less important, government efficiency likely declined
- Uses specific regional and temporal data as required
countries in Region 1 experienced a slower rate of economic growth in the period from 2000 to 2014 than countries in Region 2 did, despite increasing national government efficiency in Region 1.
- Claims Region 1 had "increasing national government efficiency" but graph shows opposite (GDP importance decreased)
- Discusses "slower rate of economic growth" which isn't what the graph measures
- Contradicts the theoretical framework and graph data
national governments of most countries in Region 2 became more efficient in the period from 2000 to 2014 than they had been in the period from 1970 to 2000, but those of several countries in this region did not.
- Focuses only on Region 2 and makes claims about "most" vs "several" countries that can't be determined from aggregate regional data
- Graph shows overall regional patterns, not individual country variations within regions
national governments of countries in Region 1 and in Region 2 generally became more efficient in the period from 2000 to 2014 than they had been in the period from 1970 to 2000, but at different rates.
- Claims both regions became more efficient, but Region 1 data shows GDP importance decreased (suggesting less efficiency)
- Contradicts the clear pattern in Region 1 where GDP per capita became less important over time