In the United States, firms often seek incentives from municipal governments to expand to those municipalities. A team of political...
GMAT Information and Ideas : (Ideas) Questions
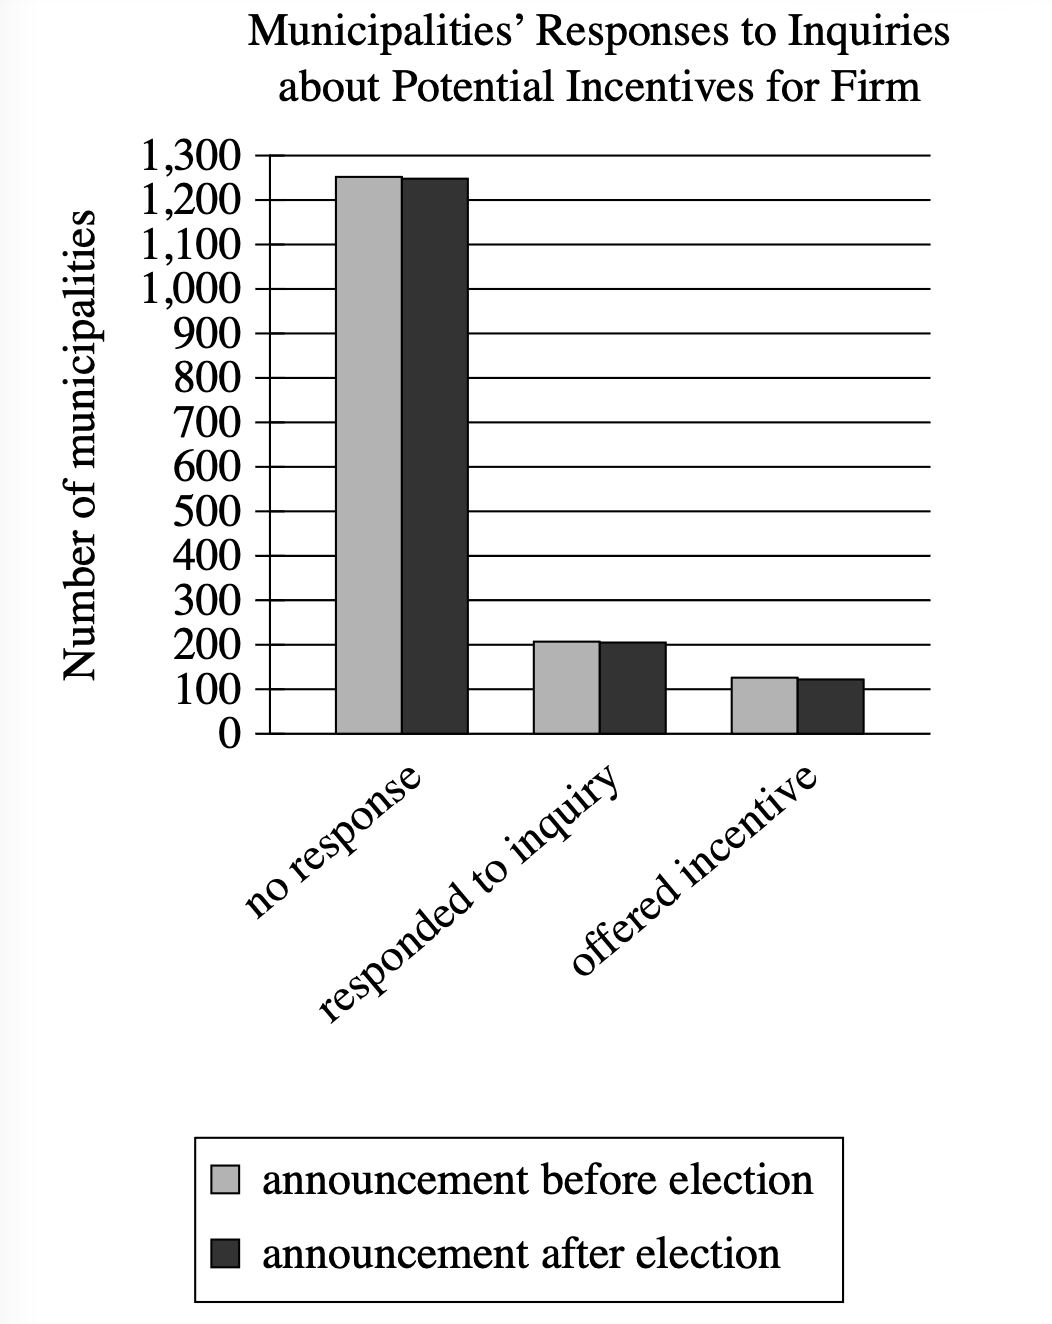
In the United States, firms often seek incentives from municipal governments to expand to those municipalities. A team of political scientists hypothesized that municipalities are much more likely to respond to firms and offer incentives if expansions can be announced in time to benefit local elected officials than if they can't. The team contacted officials in thousands of municipalities, inquiring about incentives for a firm looking to expand and indicating that the firm would announce its expansion on a date either just before or just after the next election.
Which choice best describes data from the graph that weaken the team's hypothesis?
A large majority of the municipalities that received an inquiry mentioning plans for an announcement before the next election didn't respond to the inquiry.
The proportion of municipalities that responded to the inquiry or offered incentives didn't substantially differ across the announcement timing conditions.
Only around half the municipalities that responded to inquiries mentioning plans for an announcement before the next election offered incentives.
Of the municipalities that received an inquiry mentioning plans for an announcement date after the next election, more than 1,200 didn't respond and only around 100 offered incentives.
Step 1: Decode and Map All Source Material
Part A: Create Passage Analysis Table
| Text from Passage | Analysis |
|---|---|
| 'In the United States, firms often seek incentives from municipal governments to expand to those municipalities.' |
|
| 'A team of political scientists hypothesized that municipalities are much more likely to respond to firms and offer incentives if expansions can be announced in time to benefit local elected officials than if they can't.' |
|
| 'The team contacted officials in thousands of municipalities, inquiring about incentives for a firm looking to expand and indicating that the firm would announce its expansion on a date either just before or just after the next election.' |
|
Visual Data Analysis:
Visual Type & Title: Bar chart titled 'Municipalities' Responses to Inquiries about Potential Incentives for Firm'
What It Shows:
- X-axis: 3 response categories (no response, responded to inquiry, offered incentive)
- Y-axis: Number of municipalities (0-1,300)
- Two conditions: announcement before election (gray) vs after election (black)
- Data from thousands of municipalities contacted
Key Observations:
- No response: approximately 1,250 both conditions (essentially equal)
- Responded to inquiry: approximately 200 both conditions (essentially equal)
- Offered incentive: approximately 125 both conditions (essentially equal)
- No substantial difference between timing conditions across all categories
Connection to Text: Graph tests the hypothesis directly by comparing municipal responses under the two announcement timing conditions described in the methodology.
Part B: Provide Passage Architecture & Core Elements
Visual Structure Map:
CONTEXT: Firms seek municipal incentives → HYPOTHESIS: Timing matters - before election = more response/incentives → METHOD: Test with thousands of municipalities, vary announcement timing → IMPLIED: Results should show difference if hypothesis correct
Main Point: Political scientists tested whether municipalities respond more favorably to firm incentive requests when expansions can be announced before elections to benefit local officials.
Argument Flow: The passage establishes that firms commonly seek municipal incentives, then presents a hypothesis about how announcement timing relative to elections affects municipal responsiveness. The scientists designed an experiment contacting thousands of municipalities with different announcement timing to test this hypothesis.
Text-Visual Synthesis: The text presents the hypothesis that predicts municipalities will be 'much more likely' to respond and offer incentives for pre-election announcements. The graph provides the actual results of this test, showing virtually identical response rates regardless of announcement timing, which appears to contradict the hypothesis.
Step 2: Interpret the Question Precisely
What's being asked? We need to identify which data from the graph weakens the team's hypothesis.
What type of answer do we need? A description of specific data or patterns in the graph that contradict or undermine the prediction that municipalities would be more responsive to pre-election announcement timing.
Any limiting keywords? 'data from the graph' - we must focus on what the visual shows, and 'weaken' - we need data that contradicts the hypothesis.
Step 3: Prethink the Answer
- The hypothesis predicted that municipalities would be 'much more likely to respond to firms and offer incentives' when announcements could be made before elections versus after elections
- For data to weaken this hypothesis, the graph would need to show either no difference between the timing conditions or possibly the opposite of what was predicted
- Looking at our graph analysis, we see that the response rates are essentially identical across both announcement timing conditions - approximately 1,250 gave no response in both conditions, about 200 responded to inquiries in both conditions, and around 125 offered incentives in both conditions
- This contradicts the hypothesis because if the timing really mattered as predicted, we should see substantially higher numbers for the 'before election' condition in the categories of 'responded to inquiry' and 'offered incentive'
- So the right answer should identify that there's no substantial difference between the two timing conditions in municipal responses, which directly contradicts the hypothesis that predicted a significant difference
A large majority of the municipalities that received an inquiry mentioning plans for an announcement before the next election didn't respond to the inquiry.
✗ Incorrect
- Focuses only on the fact that most municipalities didn't respond to pre-election inquiries
- Describes one condition but doesn't address the comparison between conditions that tests the hypothesis
- Missing the key point that both conditions had similar non-response rates
The proportion of municipalities that responded to the inquiry or offered incentives didn't substantially differ across the announcement timing conditions.
✓ Correct
- Directly states that response and incentive rates didn't substantially differ between announcement timing conditions
- Perfectly captures what the graph shows - nearly identical bars for all three categories
- Directly contradicts the hypothesis which predicted municipalities would be 'much more likely' to respond for pre-election announcements
- Addresses both 'responded to inquiry' and 'offered incentives' as mentioned in the hypothesis
Only around half the municipalities that responded to inquiries mentioning plans for an announcement before the next election offered incentives.
✗ Incorrect
- Focuses only on the response rate within the pre-election condition
- Doesn't make any comparison between the two timing conditions
- Information about one condition alone cannot weaken a hypothesis that's based on comparing two conditions
Of the municipalities that received an inquiry mentioning plans for an announcement date after the next election, more than 1,200 didn't respond and only around 100 offered incentives.
✗ Incorrect
- Only describes the numbers for the post-election condition
- Like choice C, fails to make the crucial comparison between conditions
- Cannot weaken a comparative hypothesis without actually comparing the conditions