Inés Ibáñez and colleagues studied a forest site in which some sugar maple trees receive periodic fertilization with nitrogen to...
GMAT Information and Ideas : (Ideas) Questions
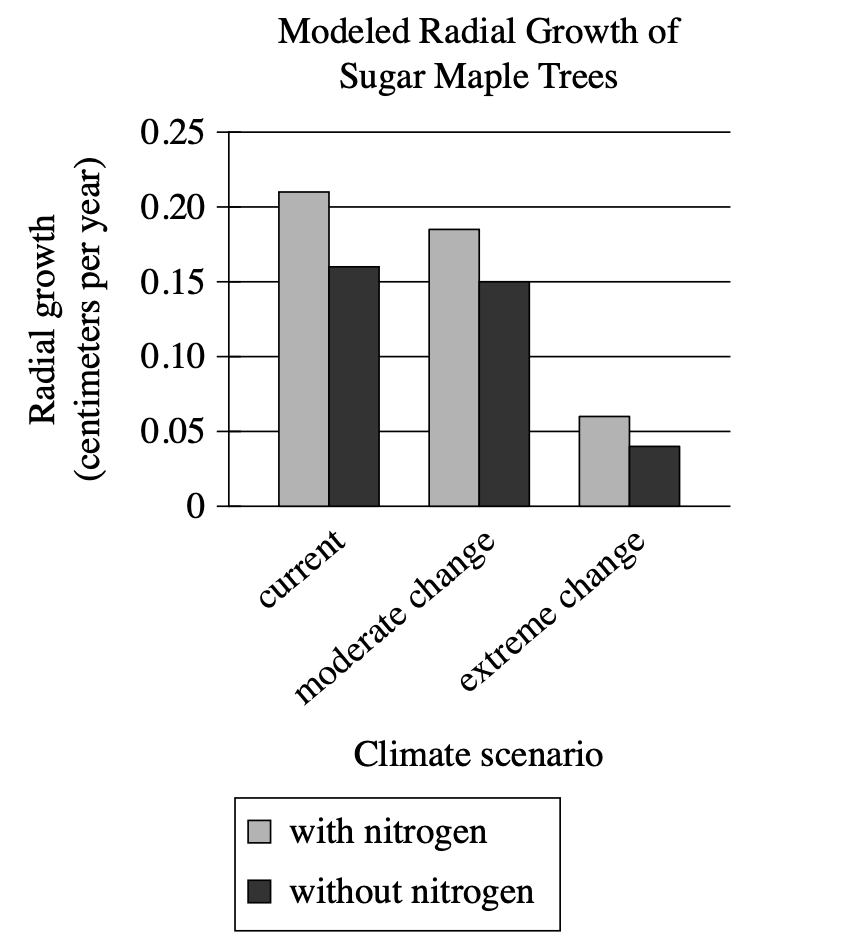
Inés Ibáñez and colleagues studied a forest site in which some sugar maple trees receive periodic fertilization with nitrogen to mimic the broader trend of increasing anthropogenic nitrogen deposition in soil. Ibáñez and colleagues modeled the radial growth of the trees with and without nitrogen fertilization under three different climate scenarios (the current climate, moderate change, and extreme change). Although they found that climate change would negatively affect growth, they concluded that anthropogenic nitrogen deposition could more than offset that effect provided that change is moderate rather than extreme.
Which choice best describes data from the graph that support Ibáñez and colleagues' conclusion?
Growth with nitrogen under the current climate exceeded growth with nitrogen under moderate change, but the latter exceeded growth without nitrogen under extreme change.
Growth without nitrogen under the current climate exceeded growth without nitrogen under moderate change, but the latter exceeded growth with nitrogen under extreme change.
Growth with nitrogen under moderate change exceeded growth without nitrogen under moderate change, but the latter exceeded growth without nitrogen under extreme change.
Growth with nitrogen under moderate change exceeded growth without nitrogen under the current climate, but the latter exceeded growth with nitrogen under extreme change.
Step 1: Decode and Map All Source Material
Part A: Create Passage Analysis Table
| Text from Passage | Analysis |
|---|---|
| "Inés Ibáñez and colleagues studied a forest site in which some sugar maple trees receive periodic fertilization with nitrogen to mimic the broader trend of increasing anthropogenic nitrogen deposition in soil." |
|
| "Ibáñez and colleagues modeled the radial growth of the trees with and without nitrogen fertilization under three different climate scenarios (the current climate, moderate change, and extreme change)." |
|
| "Although they found that climate change would negatively affect growth, they concluded that anthropogenic nitrogen deposition could more than offset that effect provided that change is moderate rather than extreme." |
|
Visual Data Analysis
Visual Type & Title: Bar chart - "Modeled Radial Growth of Sugar Maple Trees"
What It Shows: Y-axis: Radial growth (cm/year) from 0 to 0.25. X-axis: 3 climate scenarios (current, moderate change, extreme change). 2 bars per scenario: gray (with N), black (without N). Values: Current (~0.21 +N, ~0.16 -N), Moderate (~0.18 +N, ~0.15 -N), Extreme (~0.06 +N, ~0.04 -N)
Key Observations: Growth decreases as climate change severity increases (both +N and -N conditions). +N always > -N within each climate scenario. Current > Moderate > Extreme (all conditions). Extreme change causes dramatic growth reduction (~70% reduction from current).
Connection to Text: Graph provides the quantitative data supporting the text's conclusion about nitrogen's ability to offset moderate (but not extreme) climate impacts.
Part B: Provide Passage Architecture & Core Elements
Main Point: Nitrogen deposition can compensate for the negative growth effects of moderate climate change on sugar maple trees, but cannot overcome the effects of extreme climate change.
Argument Flow: The researchers set up a controlled study comparing tree growth with and without nitrogen fertilization across three climate scenarios. They discovered that while climate change consistently reduces growth, nitrogen fertilization provides enough benefit to offset moderate climate impacts, though this protective effect fails under extreme climate conditions.
Text-Visual Synthesis: The graph provides the quantitative evidence for the text's conclusion by showing specific growth measurements. The visual data reveals that nitrogen-fertilized trees under moderate climate change (0.18 cm/year) actually grow better than unfertilized trees under current conditions (0.16 cm/year), supporting the "more than offset" claim. However, under extreme change, even nitrogen-fertilized trees (0.06 cm/year) perform much worse than unfertilized trees under current conditions, confirming the limitation of nitrogen's protective effect.
Step 2: Interpret the Question Precisely
What's being asked? Which data from the graph supports Ibáñez and colleagues' specific conclusion about nitrogen deposition offsetting moderate (but not extreme) climate change effects.
What type of answer do we need? Specific data comparisons from the graph that demonstrate the conclusion's validity.
Any limiting keywords? "data from the graph" - we must reference actual visual data, and "support" - the data must provide evidence for their conclusion.
Step 3: Prethink the Answer
- The conclusion states that nitrogen deposition can "more than offset" negative climate effects if change is "moderate rather than extreme"
- To support this, the graph data should show:
- Nitrogen helps enough under moderate change to exceed some baseline performance
- This offsetting effect fails under extreme change
- A comparison that demonstrates the "more than offset" claim numerically
- Looking at our graph data: with nitrogen under moderate change (0.18) > without nitrogen under current climate (0.16), showing nitrogen truly compensates
- But with nitrogen under extreme change (0.06) < without nitrogen under current climate (0.16), showing the limitation
- So the right answer should reference these specific comparisons showing nitrogen's effectiveness under moderate conditions but failure under extreme conditions
Growth with nitrogen under the current climate exceeded growth with nitrogen under moderate change, but the latter exceeded growth without nitrogen under extreme change.
✗ Incorrect
- Compares nitrogen performance across climate scenarios but doesn't establish the "more than offset" baseline
- Doesn't show nitrogen under moderate change exceeding any meaningful comparison point
- Misses the key evidence about nitrogen's compensatory effect
Growth without nitrogen under the current climate exceeded growth without nitrogen under moderate change, but the latter exceeded growth with nitrogen under extreme change.
✗ Incorrect
- Focuses on performance without nitrogen across scenarios
- Doesn't address nitrogen's offsetting capability at all
- Trap: Students might focus on climate change effects generally rather than nitrogen's specific role in offsetting them
Growth with nitrogen under moderate change exceeded growth without nitrogen under moderate change, but the latter exceeded growth without nitrogen under extreme change.
✗ Incorrect
- Only compares within the moderate change scenario and mentions extreme change comparison
- Doesn't establish whether nitrogen under moderate change truly "offsets" climate impacts
- Fails to show the baseline comparison needed to support "more than offset"
Growth with nitrogen under moderate change exceeded growth without nitrogen under the current climate, but the latter exceeded growth with nitrogen under extreme change.
✓ Correct
- Shows nitrogen under moderate change \(\mathrm{(0.18) >}\) no nitrogen under current climate \(\mathrm{(0.16)}\) - proves "more than offset"
- Shows no nitrogen under current \(\mathrm{(0.16) >}\) nitrogen under extreme \(\mathrm{(0.06)}\) - proves extreme change limitation
- Perfectly demonstrates the conclusion: nitrogen compensates for moderate change but fails under extreme change
- Uses current climate without nitrogen as the baseline reference point for what constitutes successful "offsetting"