Investigative journalists research and report about fraud, corruption, public hazards, and more. The graph shows the number of investigative articles...
GMAT Information and Ideas : (Ideas) Questions
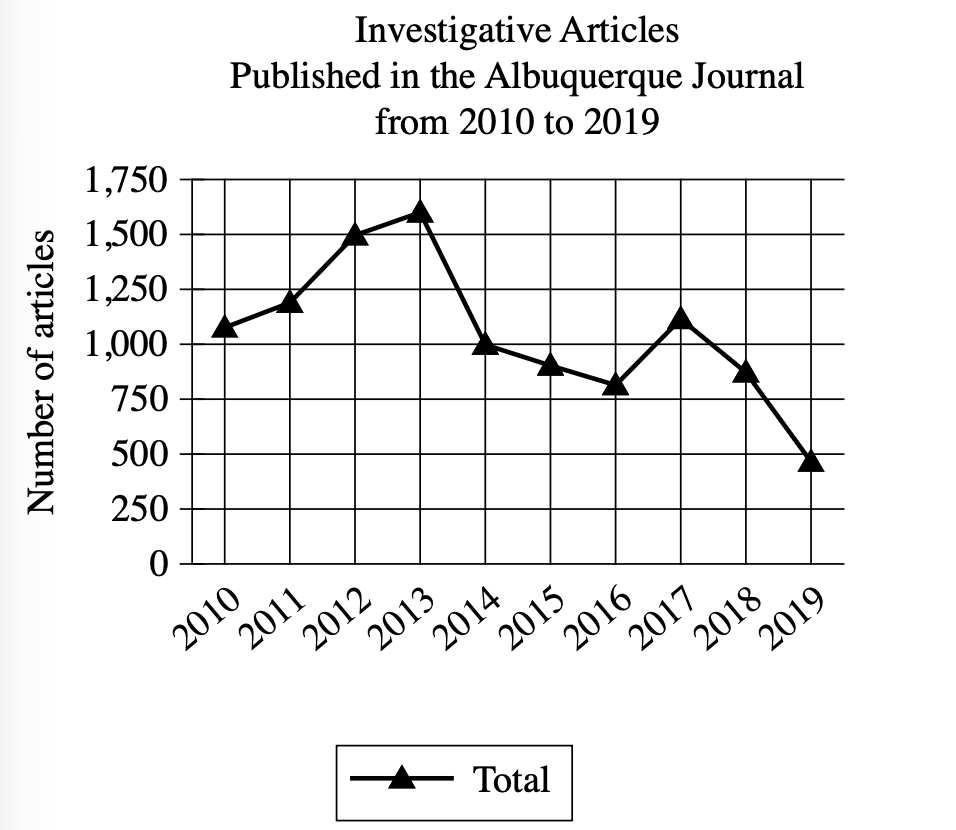
Investigative journalists research and report about fraud, corruption, public hazards, and more. The graph shows the number of investigative articles published in the Albuquerque Journal newspaper from 2010 to 2019. According to an analyst, although the number of investigative articles published in this newspaper has varied significantly over the period shown, the number overall has fallen since 2010.
Investigative journalists research and report about fraud, corruption, public hazards, and more. The graph shows the number of investigative articles published in the Albuquerque Journal newspaper from 2010 to 2019. According to an analyst, although the number of investigative articles published in this newspaper has varied significantly over the period shown, the number overall has fallen since 2010.
The newspaper published approximately 1,000 investigative articles in 2010 and approximately 500 in 2019.
The smallest annual number of investigative articles published in the newspaper during the period shown is approximately 1,600 in 2013.
The greatest annual number of investigative articles published in the newspaper during the period shown is approximately 1,000 in 2017.
The newspaper published approximately 1,000 investigative articles in 2010 and approximately 1,600 in 2013.
Step 1: Decode and Map All Source Material
Passage Analysis Table
| Text from Passage | Analysis |
|---|---|
| "Investigative journalists research and report about fraud, corruption, public hazards, and more." |
|
| "The graph shows the number of investigative articles published in the Albuquerque Journal newspaper from 2010 to 2019." |
|
| "According to an analyst, although the number of investigative articles published in this newspaper has varied significantly over the period shown, the number overall has fallen since 2010." |
|
Visual Data Analysis
Visual Type & Title: Line graph titled "Investigative Articles Published in the Albuquerque Journal from 2010 to 2019"
What It Shows:
- Y-axis: Number of articles (0 to 1,750)
- X-axis: Years (2010-2019)
- Data points connected by lines showing yearly totals
Key Observations:
- 2010: approximately 1,000 articles
- Peak: approximately 1,600 (2013)
- Low point: approximately 450 (2019)
- Pattern: Rise (2010-2013) then Drop (2013-2016) then Brief rise (2017) then Sharp drop (2018-2019)
- Overall: 2010 to 2019 = significant decrease
Connection to Text: Graph provides specific data that supports analyst's claim about variation and overall decline since 2010.
Provide Passage Architecture & Core Elements
Visual Structure Map:
[CONTEXT: What investigative journalists do] leading to [DATA INTRODUCTION: Graph shows Albuquerque Journal 2010-2019] leading to [ANALYST'S INTERPRETATION: Varied significantly but overall decline since 2010]
Main Point: An analyst observes that while investigative article publication in the Albuquerque Journal fluctuated considerably from 2010-2019, the overall trend shows a decline from the 2010 baseline.
Argument Flow: The passage establishes investigative journalism as important work, introduces graph data covering a decade of publication numbers, then presents an expert interpretation highlighting both the variation and the overall downward trend.
Text-Visual Synthesis: The visual data perfectly supports the analyst's claim by showing dramatic fluctuations while confirming the overall decline from 2010's approximately 1,000 articles to 2019's approximately 450 articles.
Step 2: Interpret the Question Precisely
What's being asked? We need to identify which statement about the graph data supports or reflects the analyst's claim about significant variation and overall decline.
What type of answer do we need? A factual statement that accurately represents what the graph shows, particularly focusing on data that demonstrates the analyst's observation.
Any limiting keywords? Does the question require visual data? Yes - this is primarily about reading and interpreting the graph data to find which choice correctly reflects what it shows.
Step 3: Prethink the Answer
- The correct answer should accurately reflect specific data points from the graph that support the analyst's claim
- Looking at our graph analysis, we need a choice that shows:
- The actual numbers for key years (especially start and end points)
- Data that demonstrates the "overall fallen since 2010" claim
- Accurate identification of highest/lowest points if mentioned
- From the graph, we can see 2010 started around 1,000 articles and 2019 ended around 450 articles, which would clearly show the overall decline
- The peak was around 1,600 in 2013, and the lowest point was 2019 at about 450
- So the right answer should accurately state data points that demonstrate the downward trend from 2010 to 2019, showing how the numbers support the analyst's observation
The newspaper published approximately 1,000 investigative articles in 2010 and approximately 500 in 2019.
- States 2010 had approximately 1,000 articles and 2019 had approximately 500 articles
- Both numbers align with the graph data (2010 approximately 1,000, 2019 approximately 450-500)
- Perfectly demonstrates the analyst's claim about overall decline since 2010
- Shows the starting and ending points that prove the downward trend
The smallest annual number of investigative articles published in the newspaper during the period shown is approximately 1,600 in 2013.
- Claims 1,600 in 2013 was the "smallest annual number"
- Graph clearly shows 2013 had the highest peak at about 1,600 articles, not the smallest
- The smallest number shown is 2019 at approximately 450 articles
- What trap this represents: Confusing highest and lowest data points when reading graphs
The greatest annual number of investigative articles published in the newspaper during the period shown is approximately 1,000 in 2017.
- Claims the greatest number was "approximately 1,000 in 2017"
- Graph shows the greatest was around 1,600 in 2013, not 2017
- 2017 actually shows about 1,100 articles, and it wasn't the peak year
- Misidentifies both the peak value and the peak year
The newspaper published approximately 1,000 investigative articles in 2010 and approximately 1,600 in 2013.
- Correctly identifies 2010 (approximately 1,000) and 2013 (approximately 1,600) data points
- However, this doesn't support the analyst's claim about overall decline
- Shows an increase from 2010 to 2013, which contradicts the "fallen since 2010" claim
- What trap this represents: Choosing accurate data that doesn't answer what the question is actually asking for