It is common for freshwater lakes near or above a latitude of 45° north of the equator, like Lake Mjøsa...
GMAT Information and Ideas : (Ideas) Questions
It is common for freshwater lakes near or above a latitude of 45° north of the equator, like Lake Mjøsa in Norway, to accumulate surface ice in winter. The amount and duration of ice depends on many factors, including local weather conditions as well as the lake's depth, volume, and surface area, but a climate researcher claims that some lakes in these latitudes have seen a decline in the duration of ice between the early 1980s and the mid-2000s. She cites as a typical example ______
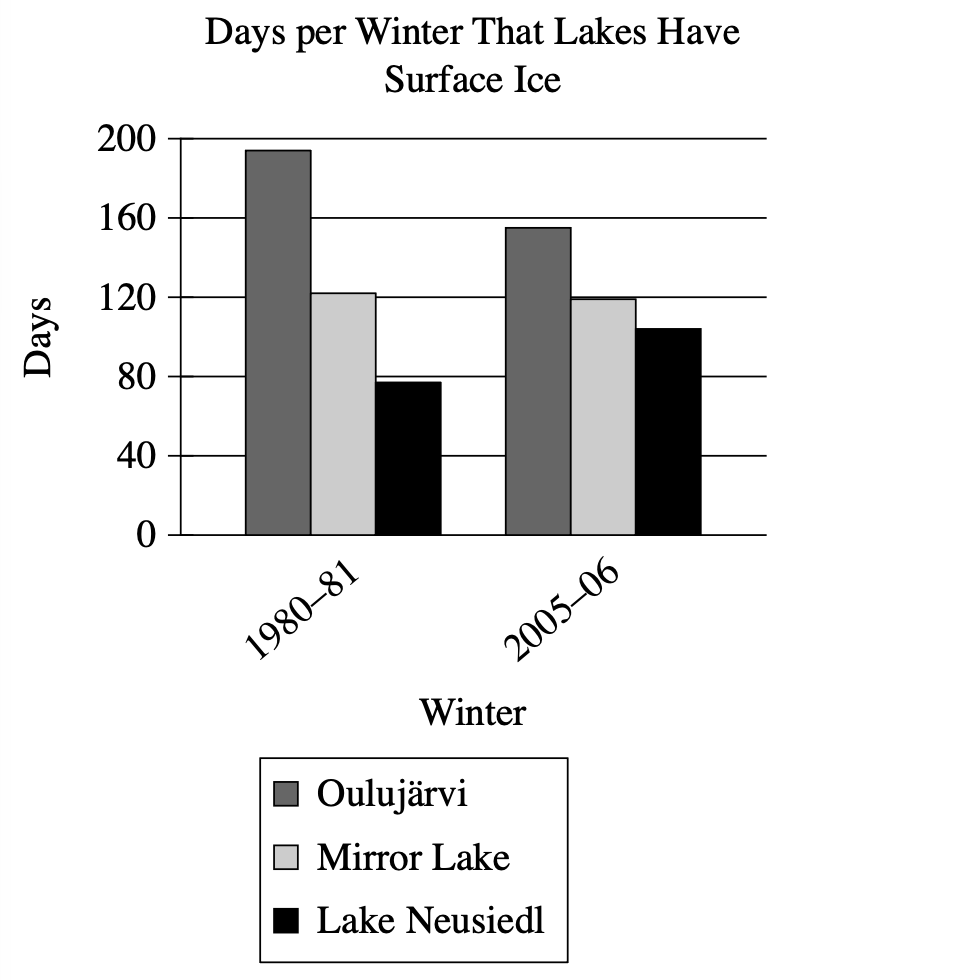
Which choice most effectively uses data from the graph to complete the researcher's example?
both Lake Neusiedl and Oulujärvi, which had fewer than 195 days of ice in the winter of 1980–81.
Lake Neusiedl, which had more days of ice in the winter of 2005–06 than it did in the winter of 1980–81.
Oulujärvi, which had fewer days of ice in the winter of 2005–06 than it did in the winter of 1980–81.
both Lake Neusiedl and Oulujärvi, which had more than 105 days of ice in the winter of 2005–06.
Step 1: Decode and Map the Passage
Part A: Passage Analysis Table
| Text from Passage | Analysis |
|---|---|
| "It is common for freshwater lakes near or above a latitude of 45° north of the equator, like Lake Mjøsa in Norway, to accumulate surface ice in winter." |
|
| "The amount and duration of ice depends on many factors, including local weather conditions as well as the lake's depth, volume, and surface area" |
|
| "but a climate researcher claims that some lakes in these latitudes have seen a decline in the duration of ice between the early 1980s and the mid-2000s." |
|
| "She cites as a typical example ______" |
|
Visual Data Analysis
Visual Type & Title: Bar chart - "Days per Winter That Lakes Have Surface Ice"
What It Shows:
- 3 lakes: Oulujärvi, Mirror Lake, Lake Neusiedl
- 2 time periods: 1980-81 vs 2005-06
- Units: Days (0-200 scale)
- Data points: Oulujärvi: 195→155 days | Mirror Lake: 122→120 days | Lake Neusiedl: 78→105 days
Key Observations:
- Oulujärvi: ↓ ~40 days (195→155)
- Mirror Lake: ↓ ~2 days (122→120)
- Lake Neusiedl: ↑ ~27 days (78→105)
- Only Oulujärvi shows significant decline supporting researcher's claim
Connection to Text: Graph provides specific examples to test researcher's claim about declining ice duration - shows mixed results with only one lake clearly supporting the claim.
Main Point: A climate researcher claims some northern lakes have experienced declining ice duration from the 1980s to 2000s and needs a typical example to support this claim.
Argument Flow: The passage establishes that northern lakes commonly freeze, notes that ice duration varies due to multiple factors, then presents a researcher's claim about declining ice duration that requires a supporting example.
Text-Visual Synthesis: The text presents the researcher's claim about declining ice duration, while the graph provides specific data for three lakes across the relevant time periods, allowing us to test which lakes actually support her claim with concrete evidence.
Step 2: Interpret the Question Precisely
This is a fill-in-the-blank question asking us to choose the best logical connector. The answer must create the right relationship between what comes before and after the blank.
Step 3: Prethink the Answer
- The researcher claims some lakes have seen a decline in ice duration between the early 1980s and mid-2000s
- To support this claim, we need an example that:
- References a lake that actually shows declining ice duration from 1980-81 to 2005-06
- Uses specific data from the graph to demonstrate this decline
- Directly supports the researcher's claim rather than contradicting it
- From our graph analysis, only Oulujärvi clearly demonstrates this pattern (195 days → 155 days = significant decline)
- Mirror Lake shows minimal decline, while Lake Neusiedl actually increased, contradicting the claim
- So the right answer should focus on Oulujärvi and highlight that it had fewer days of ice in 2005-06 than in 1980-81
both Lake Neusiedl and Oulujärvi, which had fewer than 195 days of ice in the winter of 1980–81.
✗ Incorrect
- References both Lake Neusiedl and Oulujärvi having fewer than 195 days in 1980-81
- While technically accurate about the 1980-81 data, this doesn't demonstrate decline over time
- Including Lake Neusiedl weakens the example since it actually increased in ice duration
- Focuses on absolute values rather than the trend the researcher claims
Lake Neusiedl, which had more days of ice in the winter of 2005–06 than it did in the winter of 1980–81.
✗ Incorrect
- States Lake Neusiedl had more ice days in 2005-06 than 1980-81
- This directly contradicts the researcher's claim about declining ice duration
- Shows an increase (78→105 days) rather than the claimed decrease
Oulujärvi, which had fewer days of ice in the winter of 2005–06 than it did in the winter of 1980–81.
✓ Correct
- Focuses solely on Oulujärvi, which shows clear decline (195→155 days)
- Correctly states it had fewer days of ice in 2005-06 than in 1980-81
- Directly supports the researcher's claim about declining ice duration
- Uses graph data effectively to provide a strong example of the claimed trend
both Lake Neusiedl and Oulujärvi, which had more than 105 days of ice in the winter of 2005–06.
✗ Incorrect
- References both lakes having more than 105 days in 2005-06
- While factually accurate, this doesn't address the decline claim at all
- Including Lake Neusiedl again undermines the example since it increased
- Focuses on absolute values rather than demonstrating the claimed trend