Jia Hu and colleagues hypothesized that workplace leaders who reflect on lessons learned from past mistakes are likely to exhibit...
GMAT Information and Ideas : (Ideas) Questions
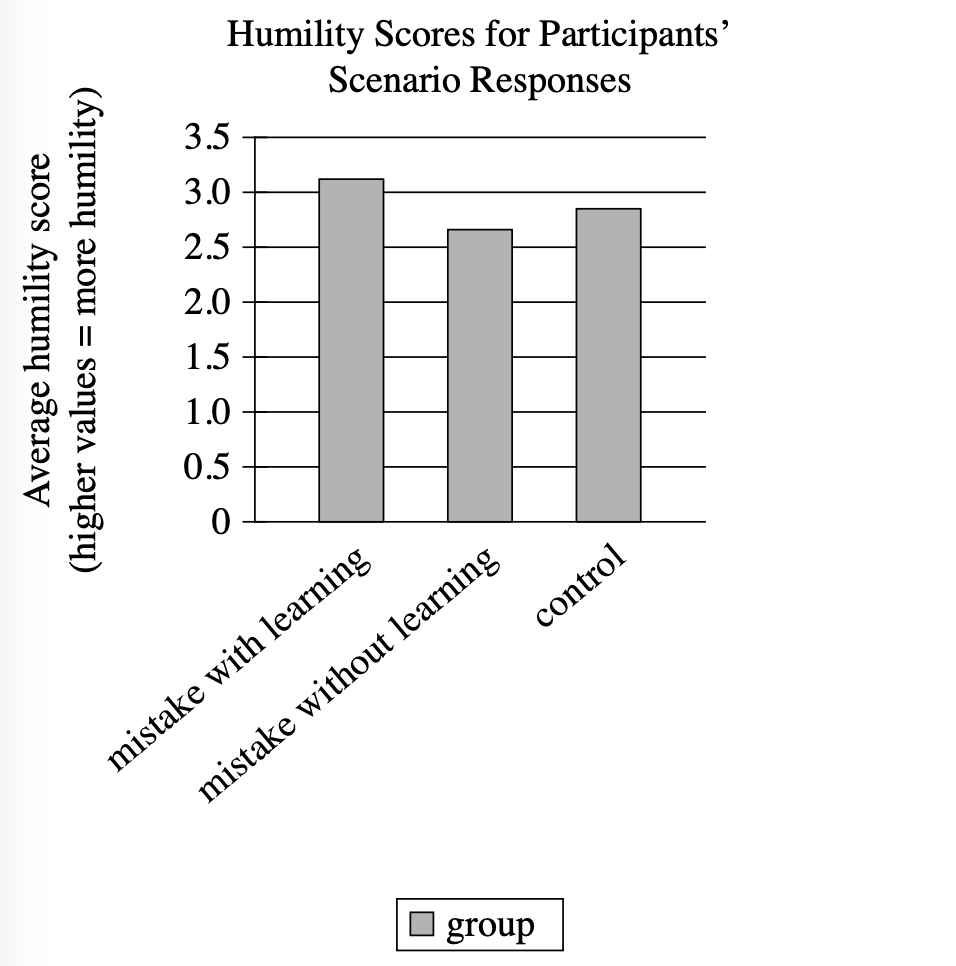
Jia Hu and colleagues hypothesized that workplace leaders who reflect on lessons learned from past mistakes are likely to exhibit more humility than leaders who don't engage in such reflection. To test this, the team placed 301 managers in one of three groups. Participants in two experimental groups were asked to reflect on a mistake, one group focusing on a mistake that resulted in learning and the other group focusing on a mistake that didn't result in learning. Participants in a control group were asked to reflect on their daily routine. All the participants then described how they would respond to a workplace scenario. After evaluating the responses for evidence of humility, the researchers concluded that their hypothesis was correct.
Which choice best describes data in the graph that support the researchers' conclusion?
None of the three groups' average humility scores exceeded 3.5.
The managers in the control group exhibited only slightly less humility on average than the managers in the two experimental groups did.
The managers who reflected on a past mistake that resulted in learning exhibited more humility on average than the managers in the other two groups did.
All three groups exhibited less humility on average than the researchers expected.
Step 1: Decode and Map All Source Material
Part A: Passage Analysis Table
| Text from Passage | Analysis |
|---|---|
| 'Jia Hu and colleagues hypothesized that workplace leaders who reflect on lessons learned from past mistakes are likely to exhibit more humility than leaders who don't engage in such reflection.' |
|
| 'To test this, the team placed 301 managers in one of three groups.' |
|
| 'Participants in two experimental groups were asked to reflect on a mistake, one group focusing on a mistake that resulted in learning and the other group focusing on a mistake that didn't result in learning.' |
|
| 'Participants in a control group were asked to reflect on their daily routine.' |
|
| 'All the participants then described how they would respond to a workplace scenario.' |
|
| 'After evaluating the responses for evidence of humility, the researchers concluded that their hypothesis was correct.' |
|
Visual Data Analysis
Visual Type & Title: Bar chart titled 'Humility Scores for Participants' Scenario Responses'
What It Shows: Y-axis: Average humility score (0 to 3.5 scale), X-axis: Three groups (mistake w/ learning, mistake w/o learning, control), Bars show average scores for each group
Key Observations: Mistake w/ learning: ~3.1 (highest), Mistake w/o learning: ~2.7 (lowest), Control: ~2.9 (middle), Pattern: learning > control > no learning
Connection to Text: Graph provides the quantitative evidence for the researchers' conclusion that their hypothesis was correct—shows mistake with learning group had highest humility scores.
Part B: Passage Architecture & Core Elements
Main Point: Researchers tested and confirmed that workplace leaders who reflect on lessons learned from past mistakes exhibit more humility than those who don't engage in such reflection.
Argument Flow: The passage presents a clear experimental study: researchers formed a hypothesis about mistake reflection and humility, designed a three-group experiment to test it, collected data through workplace scenarios, and concluded their hypothesis was supported by the evidence.
Text-Visual Synthesis: The text describes the experimental design and states the researchers confirmed their hypothesis, while the graph provides the specific quantitative evidence supporting this conclusion by showing the 'mistake with learning' group achieved the highest average humility scores (approximately 3.1) compared to the other two groups.
Step 2: Interpret the Question Precisely
What's being asked? Which data from the graph supports the researchers' conclusion that their hypothesis was correct.
What type of answer do we need? Specific evidence from the graph that shows the 'mistake with learning' condition led to higher humility scores.
Any limiting keywords? 'data in the graph' - we must focus on what the visual shows, not just the text. 'Support the researchers' conclusion' - we need evidence that confirms their hypothesis.
Step 3: Prethink the Answer
- The researchers' hypothesis was that leaders who reflect on lessons learned from past mistakes would exhibit more humility than those who don't
- For the graph to support this conclusion, it should show that the 'mistake with learning' group had higher humility scores than the other groups
- Looking at our visual analysis, the 'mistake with learning' group scored approximately 3.1, which is higher than both the 'mistake without learning' group (~2.7) and the control group (~2.9)
- So the right answer should identify that the 'mistake with learning' group achieved the highest humility scores among all three groups, demonstrating that reflecting on mistakes that led to learning does indeed increase humility as hypothesized
None of the three groups' average humility scores exceeded 3.5.
✗ Incorrect
- States that none of the groups exceeded 3.5 on the humility scale
- While this appears true from the graph, it doesn't support the researchers' conclusion about their hypothesis
- This is just a ceiling observation—it says nothing about which group performed better relative to the others
The managers in the control group exhibited only slightly less humility on average than the managers in the two experimental groups did.
✗ Incorrect
- Claims the control group showed only slightly less humility than the experimental groups
- This actually contradicts the researchers' conclusion since it suggests minimal difference between groups
- Students might think 'close scores' somehow supports the hypothesis, when actually the hypothesis requires clear differences between the groups
The managers who reflected on a past mistake that resulted in learning exhibited more humility on average than the managers in the other two groups did.
✓ Correct
- Identifies that managers who reflected on mistakes that resulted in learning exhibited more humility than the other two groups
- This directly matches what the graph shows: the 'mistake with learning' bar (~3.1) is higher than both 'mistake without learning' (~2.7) and control (~2.9)
- Perfectly supports the researchers' hypothesis that reflecting on lessons learned from mistakes leads to greater humility
All three groups exhibited less humility on average than the researchers expected.
✗ Incorrect
- Claims all groups exhibited less humility than researchers expected
- The passage never mentions what the researchers expected the humility levels to be
- This choice introduces information not present in either the text or graph