Mangroves are trees or bushes that grow on the coastlines of seas and rivers. Areas with mangroves are great places...
GMAT Information and Ideas : (Ideas) Questions
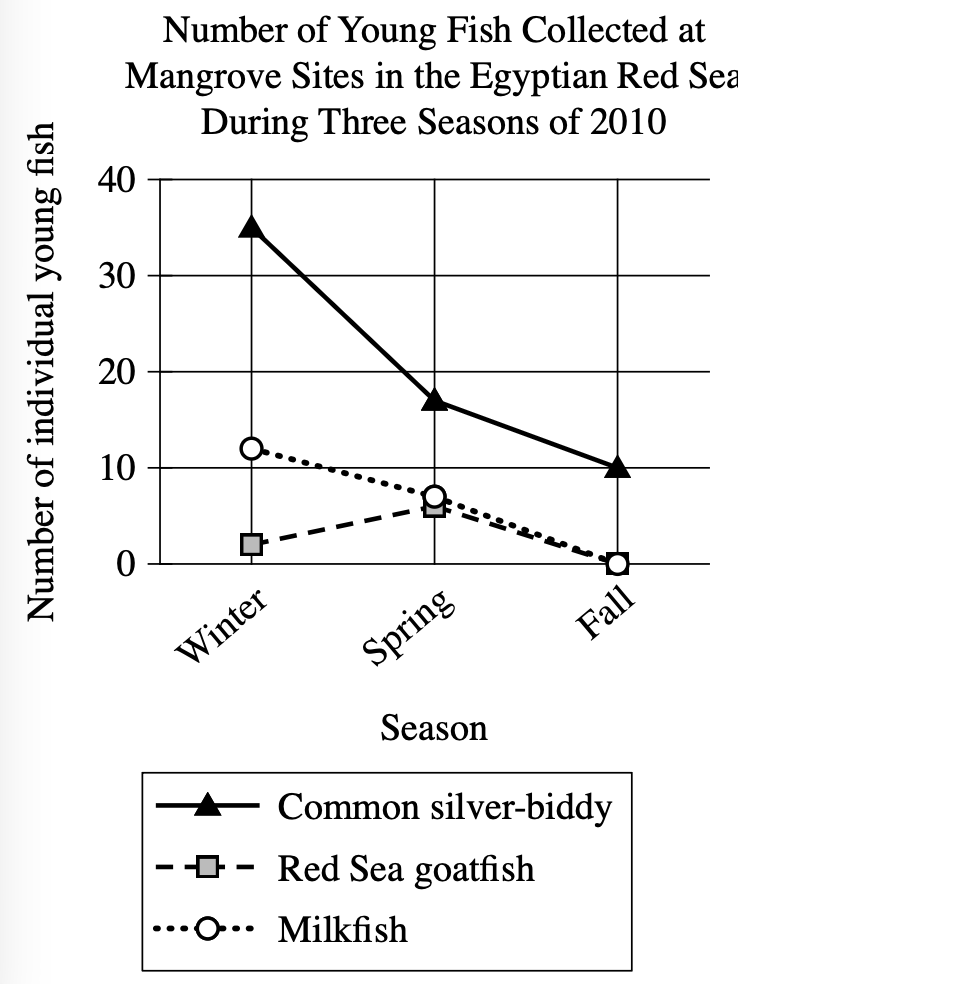
Mangroves are trees or bushes that grow on the coastlines of seas and rivers. Areas with mangroves are great places for young fish since they help keep these fish fed and protected while they grow. To study the importance of mangroves to young fish, researchers Mohamed A.Abu El-Regal and Nesreen K. Ibrahim collected and identified young fish from three different mangrove sites in the Egyptian Red Sea. They collected fish in the winter, spring, and autumn of 2010, collecting a total of 269 fish from 21 different species. For some species, more fish were collected in the winter than the other two seasons, for instance:
Which choice most effectively uses the data in the graph to complete the example?
more common silver-biddy and milkfish were collected in the winter than in either of the other two seasons.
the common silver-biddy was collected more frequently than the other two species in all three seasons.
in the spring, researchers collected more Red Sea goldfish than they collected from the other two species.
in the fall, researchers collected 10 common silver-biddy but collected no milkfish or Red Sea goatfish.
Step 1: Decode and Map All Source Material
Part A: Create Passage Analysis Table
| Text from Passage | Analysis |
|---|---|
| "Mangroves are trees or bushes that grow on the coastlines of seas and rivers." |
|
| "Areas with mangroves are great places for young fish since they help keep these fish fed and protected while they grow." |
|
| "To study the importance of mangroves to young fish, researchers Mohamed A.Abu El-Regal and Nesreen K. Ibrahim collected and identified young fish from three different mangrove sites in the Egyptian Red Sea." |
|
| "They collected fish in the winter, spring, and autumn of 2010, collecting a total of 269 fish from 21 different species." |
|
| "For some species, more fish were collected in the winter than the other two seasons, for instance: ______" |
|
Visual Data Analysis:
Visual Type & Title: Line graph - "Number of Young Fish Collected at Mangrove Sites in the Egyptian Red Sea During Three Seasons of 2010"
What It Shows: X-axis shows 3 seasons (Winter, Spring, Fall); Y-axis shows number of individual young fish (0-40 range); 3 species tracked: Common silver-biddy, Red Sea goatfish, Milkfish with data points for each species across all seasons
Key Observations:
Common silver-biddy: Winter (35) > Spring (17) > Fall (10); Milkfish: Winter (12) > Spring (7) > Fall (0);
Red Sea goatfish: Spring (6) > Winter (2) > Fall (0)
Connection to Text: Graph provides specific quantitative evidence for the text's claim that "some species" had more fish collected in winter than other seasons.
Step 2: Interpret the Question Precisely
This is a fill-in-the-blank question asking us to choose the best logical connector. The answer must create the right relationship between what comes before and after the blank.
Step 3: Prethink the Answer
- Based on my graph analysis, the text claims "some species" had more fish in winter than other seasons
- Looking at the specific data: Common silver-biddy: Winter (35) clearly exceeds both Spring (17) and Fall (10)
- Milkfish: Winter (12) clearly exceeds both Spring (7) and Fall (0)
- Red Sea goatfish: Actually peaks in Spring (6), not Winter (2)
- So the right answer should identify the two species that actually follow the winter-peak pattern: common silver-biddy and milkfish
more common silver-biddy and milkfish were collected in the winter than in either of the other two seasons.
- This perfectly matches the graph data: common silver-biddy (35 winter vs. 17 spring, 10 fall) and milkfish (12 winter vs. 7 spring, 0 fall) both peak in winter
- Directly supports the text's claim about "some species" having more winter collection
the common silver-biddy was collected more frequently than the other two species in all three seasons.
- This compares common silver-biddy to other species across seasons, not winter vs. other seasons for the same species
- Misses the point - the text needs examples of winter > other seasons pattern
in the spring, researchers collected more Red Sea goldfish than they collected from the other two species.
- Focuses on spring data, not winter pattern
- While the graph shows Red Sea goatfish peaked in spring (6), this contradicts the text's focus on winter abundance
in the fall, researchers collected 10 common silver-biddy but collected no milkfish or Red Sea goatfish.
- Discusses fall data (10 common silver-biddy, 0 for others), not winter superiority
- The numbers appear accurate but don't support the winter abundance claim