Many plants lose their leaf color when exposed to kanamycin, an antibiotic produced by some soil microorganisms. Spelman College biologist...
GMAT Information and Ideas : (Ideas) Questions
Many plants lose their leaf color when exposed to kanamycin, an antibiotic produced by some soil microorganisms. Spelman College biologist Mentewab Ayalew and her colleagues hypothesized that plants' response to kanamycin exposure involves altering their uptake of metals, such as iron and zinc. The researchers grew two groups of seedlings of the plant Arabidopsis thaliana, half of which were exposed to kanamycin and half of which were a control group without exposure to kanamycin, and measured the plants' metal content five days after germination.
The control plants contained higher levels of zinc than iron, but plants exposed to kanamycin contained higher levels of iron than zinc.
Both groups of plants contained more than 200 parts per million of both iron and zinc.
Zinc levels were around 300 parts per million in the control plants but nearly 400 parts per million in the plants exposed to kanamycin.
The plants exposed to kanamycin showed lower levels of iron and zinc than the control plants did.
Step 1: Decode and Map All Source Material
Passage Analysis Table
| Text from Passage | Analysis |
|---|---|
| Many plants lose their leaf color when exposed to kanamycin, an antibiotic produced by some soil microorganisms. |
|
| Spelman College biologist Mentewab Ayalew and her colleagues hypothesized that plants' response to kanamycin exposure involves altering their uptake of metals, such as iron and zinc. |
|
| The researchers grew two groups of seedlings of the plant Arabidopsis thaliana, half of which were exposed to kanamycin and half of which were a control group without exposure to kanamycin, and measured the plants' metal content five days after germination. |
|
Visual Data Analysis
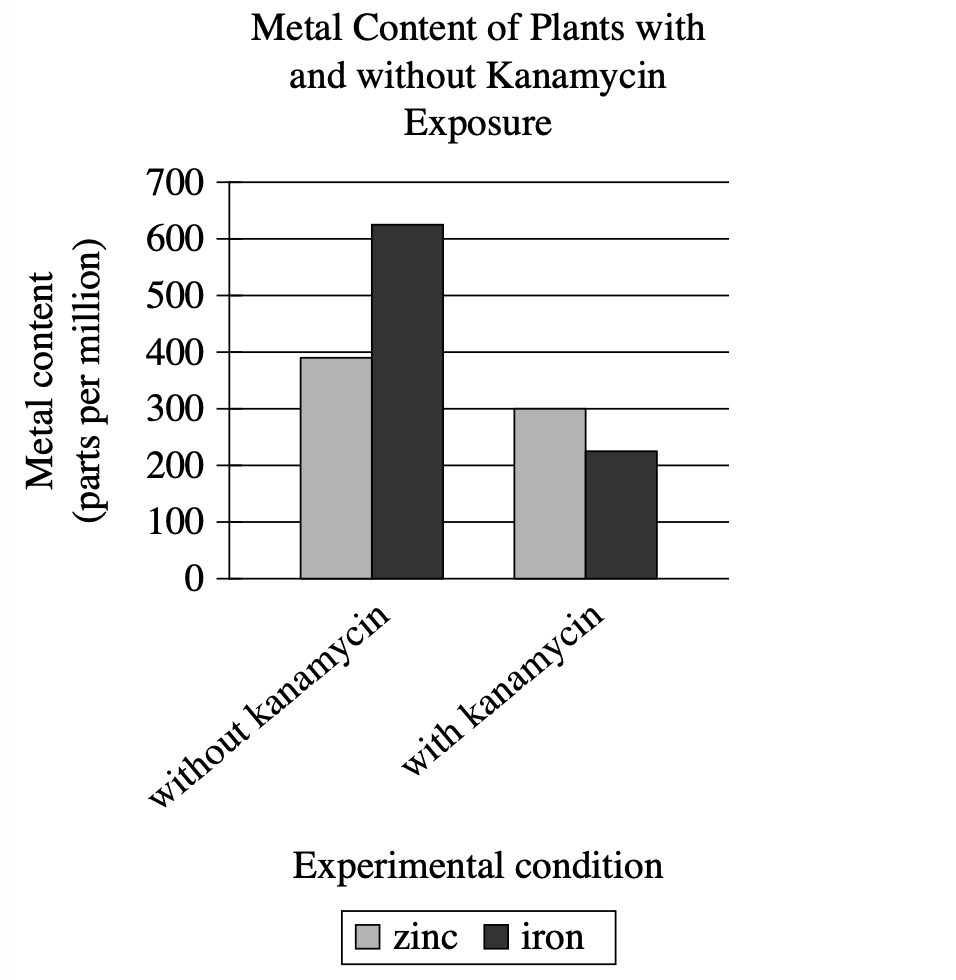
Visual Type & Title: Bar chart - Metal Content of Plants with and without Kanamycin Exposure
What It Shows: X-axis: 2 conditions (without kanamycin, with kanamycin); Y-axis: Metal content (parts per million, 0-700 range); 2 metals measured: zinc (gray bars), iron (black bars); Data points: Without kanamycin: Zn ≈ 400 ppm, Fe ≈ 620 ppm; With kanamycin: Zn ≈ 300 ppm, Fe ≈ 220 ppm
Key Observations: Both metals decrease with kanamycin exposure; Fe drops more dramatically: 620→220 (65% decrease); Zn drops moderately: 400→300 (25% decrease); Without kanamycin: Fe > Zn; With kanamycin: Zn > Fe (relationship flips)
Connection to Text: Graph provides the actual data testing Ayalew's hypothesis about altered metal uptake - shows quantified differences between experimental conditions.
Passage Architecture & Core Elements
Main Point: Researchers tested whether kanamycin exposure alters plants' metal uptake by comparing metal content between treated and control plant groups.
Argument Flow: The passage establishes an observable phenomenon (color loss), presents a hypothesis to explain it (altered metal uptake), and describes an experiment designed to test that hypothesis through direct measurement.
Text-Visual Synthesis: The text sets up the research question and experimental approach, while the graph provides the crucial data showing that metal uptake was indeed different between the two groups, with both iron and zinc levels lower in kanamycin-exposed plants.
Step 2: Interpret the Question Precisely
What's being asked? Which data from the graph supports the researchers' hypothesis
What type of answer do we need? Evidence that shows kanamycin affects metal uptake
Any limiting keywords? 'data in the graph' - must reference the visual data specifically
Step 3: Prethink the Answer
- The hypothesis claims that kanamycin exposure 'involves altering their uptake of metals'
- For data to support this hypothesis, we need to see that the metal content is different between the two groups of plants
- Looking at our graph analysis, we see clear differences: both zinc and iron levels are lower in the kanamycin-exposed plants compared to the control group
- The iron dropped dramatically (from ~620 to ~220 ppm) and zinc dropped moderately (from ~400 to ~300 ppm)
- So the right answer should identify that the kanamycin-exposed plants had different metal levels than the control plants, specifically lower levels of both metals, which demonstrates that kanamycin did indeed alter metal uptake
The control plants contained higher levels of zinc than iron, but plants exposed to kanamycin contained higher levels of iron than zinc.
✗ Incorrect
- Claims the metal proportions flipped between groups (control had more Zn than Fe, treated had more Fe than Zn)
- This describes a real pattern in the data but misses the key support for the hypothesis
- What trap this represents: Focuses on an interesting detail rather than the main evidence that supports the hypothesis
Both groups of plants contained more than 200 parts per million of both iron and zinc.
✗ Incorrect
- States both groups contained more than \(\mathrm{200\,ppm}\) of both metals
- This is factually true based on the graph but doesn't show any difference between groups
- Provides no evidence that kanamycin altered uptake since it doesn't compare the groups
Zinc levels were around 300 parts per million in the control plants but nearly 400 parts per million in the plants exposed to kanamycin.
✗ Incorrect
- Claims zinc levels were \(\sim\mathrm{300\,ppm}\) in control but \(\sim\mathrm{400\,ppm}\) in kanamycin plants
- This reverses the actual data - control plants had \(\sim\mathrm{400\,ppm}\) zinc, kanamycin plants had \(\sim\mathrm{300\,ppm}\)
- Contradicts what the graph actually shows
The plants exposed to kanamycin showed lower levels of iron and zinc than the control plants did.
✓ Correct
- Accurately states that kanamycin-exposed plants showed lower levels of both iron and zinc compared to control plants
- This directly supports the hypothesis by demonstrating that kanamycin exposure resulted in altered (specifically reduced) metal uptake
- Matches our graph analysis: Fe dropped from \(\sim\mathrm{620\,ppm}\) to \(\sim\mathrm{220\,ppm}\), Zn dropped from \(\sim\mathrm{400\,ppm}\) to \(\sim\mathrm{300\,ppm}\)