The California Condor Recovery Program is working to protect this large, rare American vulture from extinction. The program captured 27...
GMAT Information and Ideas : (Ideas) Questions
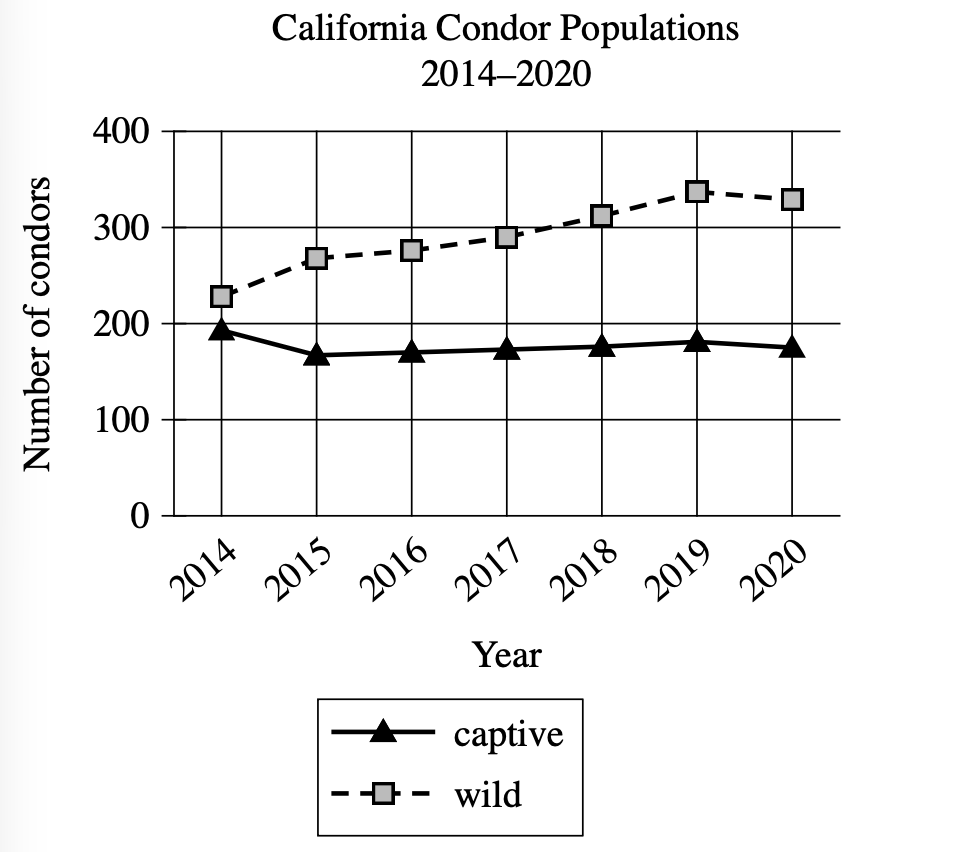
The California Condor Recovery Program is working to protect this large, rare American vulture from extinction. The program captured 27 wild condors in 1987 in order to protect and breed them. Captive birds have been reintroduced into the wild since 1992. Although the California condor is still a rare species, many biologists claim that the program has been reasonably successful.
Which choice best describes data from the graph that support the biologists' claim?
The number of captive California condors steadily decreased between 2014 and 2020.
The numbers of California condors living both in captivity and in the wild decreased only slightly from 2019 to 2020.
The difference between the number of captive and wild California condors remained relatively steady between 2014 and 2017.
The number of wild California condors increased overall from 2014 to 2020 and exceeded the number of those living in captivity.
Step 1: Decode and Map All Source Material
Passage Analysis Table
| Text from Passage | Analysis |
|---|---|
| 'The California Condor Recovery Program is working to protect this large, rare American vulture from extinction.' |
|
| 'The program captured 27 wild condors in 1987 in order to protect and breed them.' |
|
| 'Captive birds have been reintroduced into the wild since 1992.' |
|
| 'Although the California condor is still a rare species, many biologists claim that the program has been reasonably successful.' |
|
Visual Data Analysis
Visual Type & Title: Line graph - 'California Condor Populations 2014-2020'
What It Shows:
- X-axis: Years (2014-2020)
- Y-axis: Number of condors (0-400)
- Two lines: captive (solid, triangles) & wild (dashed, squares)
- 7-year tracking period
Key Observations:
- Captive pop: ~190 to 170 (slight decrease, relatively stable)
- Wild pop: ~230 to 330 (steady increase, ~43% growth)
- 2015/2016: wild population exceeds captive population
- Gap widening: wild increasingly exceeds captive
Connection to Text: Graph quantifies the 'reasonably successful' claim by showing wild population growth and exceeding captive numbers—exactly what a reintroduction program aims for.
Passage Architecture & Core Elements
Main Point: The California Condor Recovery Program, despite the species remaining rare, is considered reasonably successful by biologists based on its capture-breed-release strategy.
Argument Flow: The passage establishes the program's conservation mission, outlines its two-phase approach (initial capture for breeding, then reintroduction), and concludes with the expert assessment that requires data support.
Text-Visual Synthesis: The text provides the qualitative claim of 'reasonable success' while the graph provides quantitative evidence through population trends.
Step 2: Interpret the Question Precisely
What's being asked? Which data from the graph supports the biologists' claim that the program has been 'reasonably successful'
What type of answer do we need? Specific evidence from the graph that would justify calling a conservation program successful
Any limiting keywords? 'data from the graph' - we must reference the visual data, and 'support' - the data must back up the success claim
Step 3: Prethink the Answer
- For a conservation program focused on breeding captive animals and reintroducing them to the wild, success would mean:
- Wild population growing (not declining)
- Wild population ideally becoming larger than captive population (showing reintroduction is working)
- Overall species numbers improving
- Looking at our graph analysis, the wild population increased from ~230 to ~330 (about 43% growth), and by 2015-2016, the wild population exceeded the captive population. This is exactly what you'd want to see in a successful reintroduction program.
The number of captive California condors steadily decreased between 2014 and 2020.
- Claims captive population 'steadily decreased'
- Graph shows captive population remained relatively stable (~190 to ~170), not a steady decrease
- Even if true, this wouldn't necessarily indicate program success
The numbers of California condors living both in captivity and in the wild decreased only slightly from 2019 to 2020.
- Focuses only on 2019-2020 change, which was minimal for both populations
- Doesn't address overall program success over the full time period
- Missing the bigger picture of wild population growth
The difference between the number of captive and wild California condors remained relatively steady between 2014 and 2017.
- States difference between captive/wild populations stayed steady 2014-2017
- This would suggest no progress, not success
- Ignores that wild population was growing and overtaking captive population
The number of wild California condors increased overall from 2014 to 2020 and exceeded the number of those living in captivity.
- Accurately describes wild population increase from ~230 (2014) to ~330 (2020)
- Notes that wild population exceeded captive population (crossover around 2015-2016)
- This is exactly what indicates success: more condors living in the wild than in captivity, showing effective reintroduction