The Jordanelle Dam was built on the Provo River in Utah in 1992. Earth scientist Adriana E. Martinez and colleagues...
GMAT Information and Ideas : (Ideas) Questions
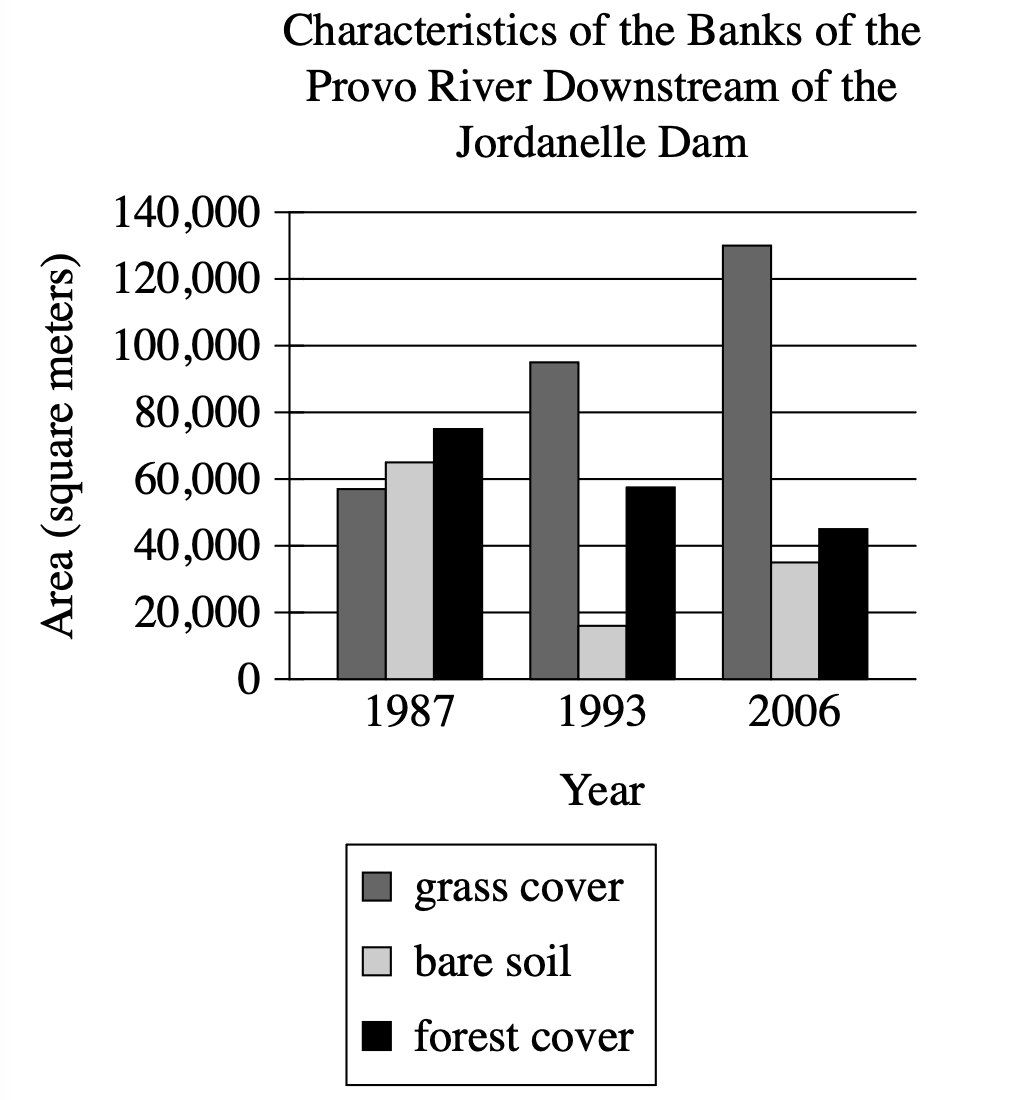
The Jordanelle Dam was built on the Provo River in Utah in 1992. Earth scientist Adriana E. Martinez and colleagues tracked changes to the environment on the banks of the river downstream of the dam, including how much grass and forest cover were present. They concluded that the dam changed the flow of the river in ways that benefited grass plants but didn't benefit trees.
Which choice best describes data from the graph that support Martinez and colleagues' conclusion?
The lowest amount of grass cover was approximately 58,000 square meters, and the highest amount of forest cover was approximately 75,000 square meters.
There was more grass cover than forest cover in 1987, and this difference increased dramatically in 1993 and again in 2006.
There was less grass cover than bare soil in 1987 but more grass cover than bare soil in 1993 and 2006, whereas there was more forest cover than bare soil in all three years.
Grass cover increased from 1987 to 1993 and from 1993 to 2006, whereas forest cover decreased in those periods.
Step 1: Decode and Map All Source Material
Part A: Passage Analysis Table
| Text from Passage | Analysis |
|---|---|
| 'The Jordanelle Dam was built on the Provo River in Utah in 1992.' |
|
| 'Earth scientist Adriana E. Martinez and colleagues tracked changes to the environment on the banks of the river downstream of the dam, including how much grass and forest cover were present.' |
|
| 'They concluded that the dam changed the flow of the river in ways that benefited grass plants but didn't benefit trees.' |
|
Visual Data Analysis:
Visual Type & Title: Bar chart titled 'Characteristics of the Banks of the Provo River Downstream of the Jordanelle Dam'
What It Shows: Y-axis: Area in square meters (0-140,000), X-axis: Years (1987, 1993, 2006), Three categories: grass cover (dark gray), bare soil (light gray), forest cover (black)
Key Observations: Grass cover increased dramatically (58K to 95K to 130K), Forest cover decreased steadily (75K to 58K to 45K), Dam built 1992 = between first two measurements
Step 2: Interpret the Question Precisely
What's being asked? Which data from the graph supports Martinez's conclusion about the dam's effects.
What type of answer do we need? Specific evidence from the graph that shows grass benefiting and trees not benefiting after the dam was built.
Any limiting keywords? None identified.
Step 3: Prethink the Answer
- Since Martinez concluded that the dam benefited grass but didn't benefit trees, we need graph data showing grass improving while trees got worse after 1992
- The right answer should show that grass cover increased over time while forest cover decreased
The lowest amount of grass cover was approximately 58,000 square meters, and the highest amount of forest cover was approximately 75,000 square meters.
✗ Incorrect
- States minimum grass cover and maximum forest cover but these are just isolated data points that don't show trends over time
There was more grass cover than forest cover in 1987, and this difference increased dramatically in 1993 and again in 2006.
✗ Incorrect
- Compares relative amounts of grass vs. forest within each year but doesn't clearly show that grass benefited while trees were harmed
There was less grass cover than bare soil in 1987 but more grass cover than bare soil in 1993 and 2006, whereas there was more forest cover than bare soil in all three years.
✗ Incorrect
- Compares each vegetation type to bare soil rather than tracking grass vs. trees over time
Grass cover increased from 1987 to 1993 and from 1993 to 2006, whereas forest cover decreased in those periods.
✓ Correct
- Shows grass cover increased from 1987 to 1993 to 2006 (benefited) and forest cover decreased in those same periods (didn't benefit), directly matching Martinez's conclusion