The share of the world's population living in cities has increased dramatically since 1970, but this change has not been...
GMAT Information and Ideas : (Ideas) Questions
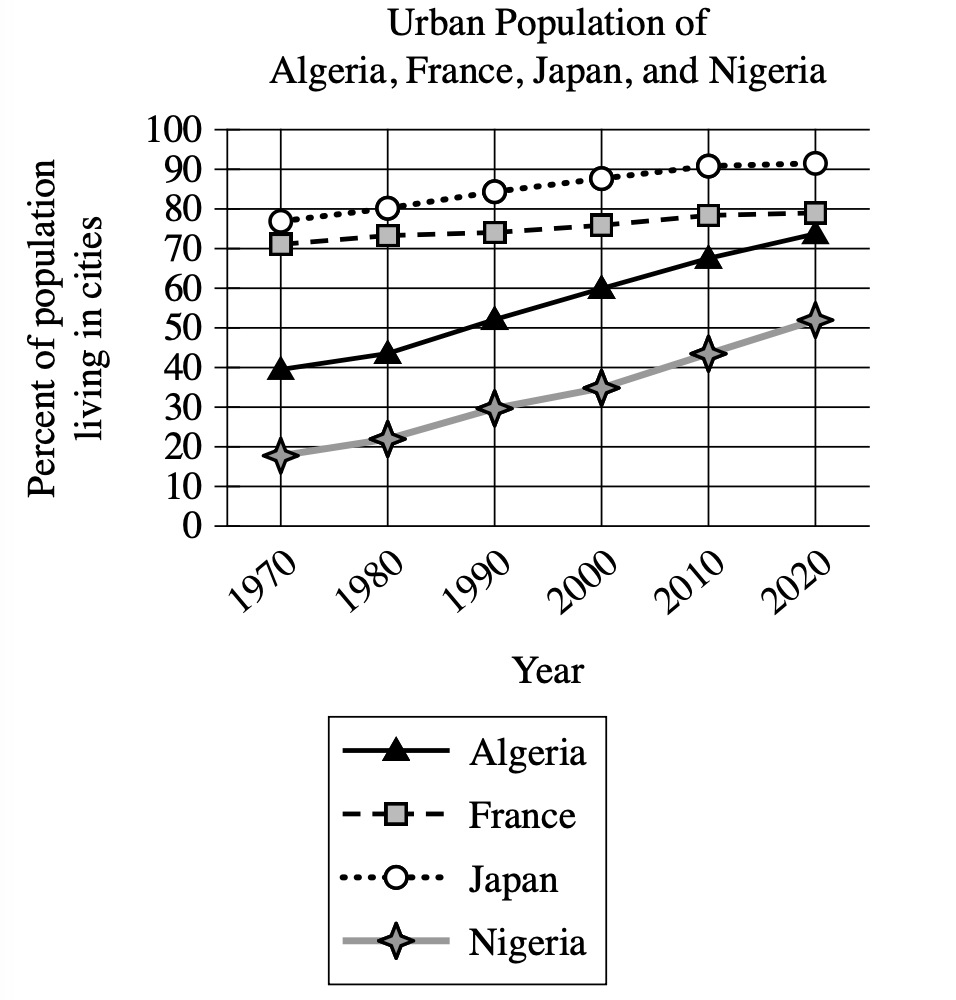
The share of the world's population living in cities has increased dramatically since 1970, but this change has not been uniform. France and Japan, for example, were already heavily urbanized in 1970, with 70% or more of the population living in cities. The main contributors to the world's urbanization since 1970 have been countries like Algeria, whose population went from ______
Which choice most effectively uses data from the graph to complete the assertion?
around 50% urban in 1970 to around 90% urban in 2020.
less than 40% urban in 1970 to around 90% urban in 2020.
less than 20% urban in 1970 to more than 50% urban in 2020.
around 40% urban in 1970 to more than 70% urban in 2020.
Step 1: Decode and Map All Source Material
Passage Analysis Table:
| Text from Passage | Analysis |
|---|---|
| "The share of the world's population living in cities has increased dramatically since 1970, but this change has not been uniform." |
|
| "France and Japan, for example, were already heavily urbanized in 1970, with 70% or more of the population living in cities." |
|
| "The main contributors to the world's urbanization since 1970 have been countries like Algeria, whose population went from ____" |
|
Visual Data Analysis:
Visual Type & Title: Line graph - "Urban Population of Algeria, France, Japan, and Nigeria"
What It Shows: Y-axis shows % population in cities (0-100%), X-axis shows years (1970-2020, 10-year intervals), four countries' urbanization trends over 50 years.
Key data points from graph:
- Algeria: 1970 ~40%, 2020 ~73%
- France: 1970 ~72%, 2020 ~81%
- Japan: 1970 ~77%, 2020 ~92%
- Nigeria: 1970 ~17%, 2020 ~52%
Key Observations:
- France and Japan were already highly urbanized by 1970 and increased steadily.
- Algeria and Nigeria started lower but experienced sharper urbanization growth.
- Algeria's urban population rose approximately 33 percentage points over 50 years.
Connection to Passage: Graph quantifies textual claims about urbanization patterns since 1970 and supports the identification of Algeria-like countries as principal contributors to global urbanization.
Step 2: Interpret the Question Precisely
This is a fill-in-the-blank question expecting a logical connector or data fragment that fits the narrative about Algeria's urbanization contribution.
The correct answer must reliably reflect Algeria's urbanization figures.
Step 3: Prethink the Answer
- Correct answer must accurately state Algeria's 1970 urbanization percentage and 2020 urbanization percentage.
- The data shows Algeria around 40% urban in 1970, increasing to about 73% by 2020.
- This supports Algeria's role as a main contributor to global urbanization growth since 1970.
around 50% urban in 1970 to around 90% urban in 2020.
✗ Incorrect
- States Algeria was "around 50% urban in 1970" which conflicts with graph data (\(\sim40\%\)).
- States Algeria was 90% in 2020 which overestimates graph data (\(\sim73\%\)).
less than 40% urban in 1970 to around 90% urban in 2020.
✗ Incorrect
- Claims "less than 40% urban in 1970" but graph shows close to 40%, not less.
- States 90% in 2020, inconsistent with graph (\(\sim73\%\)).
less than 20% urban in 1970 to more than 50% urban in 2020.
✗ Incorrect
- Claims "less than 20% urban in 1970" which underestimates actual (\(\sim40\%\)).
around 40% urban in 1970 to more than 70% urban in 2020.
✓ Correct
- Accurately reports Algeria's urbanization as "around 40% in 1970".
- Correctly states urbanization exceeds 70% by 2020 (\(\sim73\%\)).
- Demonstrates substantial growth matching Algeria's role as a main contributor to global urbanization.