To investigate the effect of lizard predation on spider populations, a student in a biology class placed spiders in two...
GMAT Information and Ideas : (Ideas) Questions
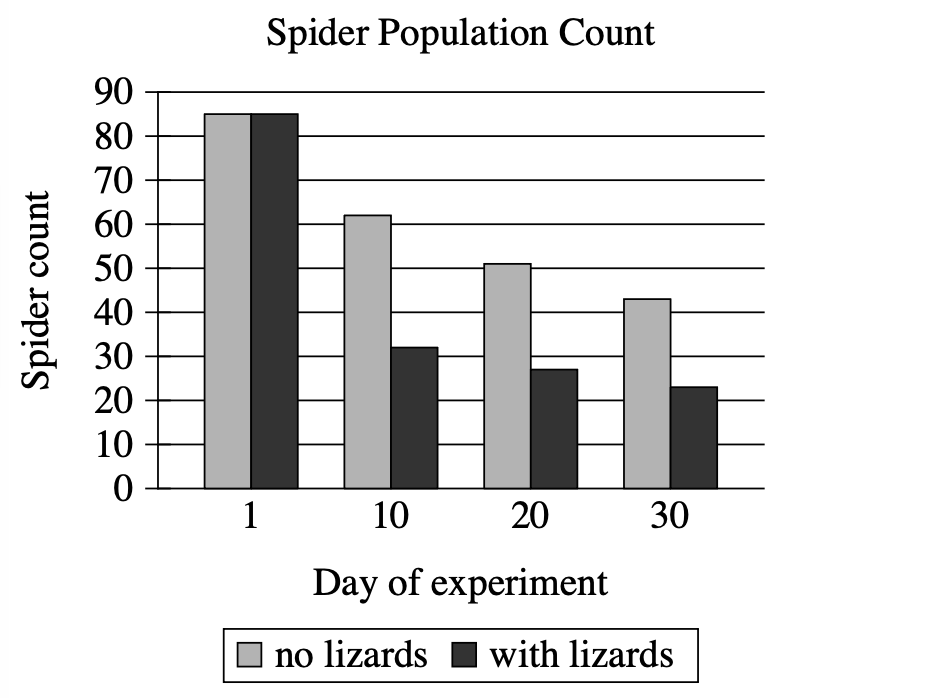
To investigate the effect of lizard predation on spider populations, a student in a biology class placed spiders in two enclosures, one with lizards and one without, and tracked the number of spiders in the enclosures for 30 days. The student concluded that the reduction in the spider population count in the enclosure with lizards by day 30 was entirely attributable to the presence of the lizards.
Which choice best describes data from the graph that weaken the student's conclusion?
The spider population count was the same in both enclosures on day 1.
The spider population count also substantially declined by day 30 in the enclosure without lizards.
The largest decline in spider population count in the enclosure with lizards occurred from day 1 to day 10.
The spider population count on day 30 was lower in the enclosure with lizards than in the enclosure without lizards.
Step 1: Decode and Map All Source Material
Part A: Create Passage Analysis Table
| Text from Passage | Analysis |
|---|---|
| "To investigate the effect of lizard predation on spider populations, a student in a biology class placed spiders in two enclosures, one with lizards and one without, and tracked the number of spiders in the enclosures for 30 days." |
|
| "The student concluded that the reduction in the spider population count in the enclosure with lizards by day 30 was entirely attributable to the presence of the lizards." |
|
Visual Data Analysis:
Visual Type & Title: Bar chart - "Spider Population Count"
What It Shows: X-axis: Days (1, 10, 20, 30), Y-axis: Spider count (0-90), Two conditions: gray bars = no lizards, black bars = with lizards, Time period: 30-day experiment
Key Observations: Day 1: Both approximately 85 spiders (equal start), Day 10: No lizards about 62, With lizards about 33 (both declined), Day 20: No lizards about 52, With lizards about 27 (both continue declining), Day 30: No lizards about 44, With lizards about 23 (both continue declining), Overall: No lizards declined about 48% (85 to 44), With lizards declined about 73% (85 to 23)
Connection to Text: Graph provides the data that allows us to evaluate the student's conclusion about lizard predation being the sole cause of population decline.
Part B: Provide Passage Architecture & Core Elements
Main Point: A student concluded that lizards were entirely responsible for spider population decline in an experimental enclosure.
Argument Flow: The passage briefly describes a controlled experiment comparing spider populations with and without lizard predators, then states the student's conclusion attributing all population decline to lizard presence.
Text-Visual Synthesis: The text presents the student's conclusion while the graph provides the actual experimental data needed to evaluate that conclusion. The visual reveals population trends in both conditions that weren't described in the text, allowing us to assess whether the student's reasoning was sound.
Step 2: Interpret the Question Precisely
What's being asked? We need to identify which data from the graph weakens the student's conclusion.
What type of answer do we need? Specific evidence from the graph that contradicts or undermines the student's reasoning.
Any limiting keywords? "from the graph" - we must focus on visual data, and "weaken" - we need evidence that makes the conclusion less credible.
Step 3: Prethink the Answer
- The student concluded that the spider population decline was "entirely attributable" to lizard presence
- This means the student believes lizards are the ONLY cause of the population drop
- To weaken this conclusion, we'd need evidence suggesting other factors are also causing spider deaths
- Looking at our graph analysis, we see that the "no lizards" enclosure also experienced substantial decline (from about 85 to about 44 spiders - about 48% reduction)
- This is crucial because it shows spiders are dying even without lizard predation, indicating other factors at work
- So the right answer should point out that the control group (no lizards) also showed significant population decline, which contradicts the idea that lizards are the sole cause
The spider population count was the same in both enclosures on day 1.
- This describes equal starting populations, which actually supports good experimental design
- Having the same initial count doesn't weaken the conclusion about what caused the decline
- This data strengthens the experiment's validity rather than weakening the student's reasoning
The spider population count also substantially declined by day 30 in the enclosure without lizards.
- This directly identifies the key weakening evidence: substantial decline in the no-lizards enclosure
- From the graph: no-lizards group dropped from about 85 to about 44 spiders (\(48\%\) decline)
- This contradicts "entirely attributable to lizards" because spiders are clearly dying from other causes too
The largest decline in spider population count in the enclosure with lizards occurred from day 1 to day 10.
- This describes timing of decline in the lizard enclosure (steepest drop day 1-10)
- Timing information doesn't challenge whether lizards caused the decline
- Actually supports the idea that lizards had an immediate impact
The spider population count on day 30 was lower in the enclosure with lizards than in the enclosure without lizards.
- This confirms lizard enclosure had fewer spiders at day 30, which supports the student's conclusion
- Lower final count with lizards present reinforces that lizards affected spider survival
- This strengthens rather than weakens the conclusion