To investigate the influence of certain estrogen-responsive neurons on energy expenditure, biologist Stephanie Correa et al. treated female and male...
GMAT Information and Ideas : (Ideas) Questions
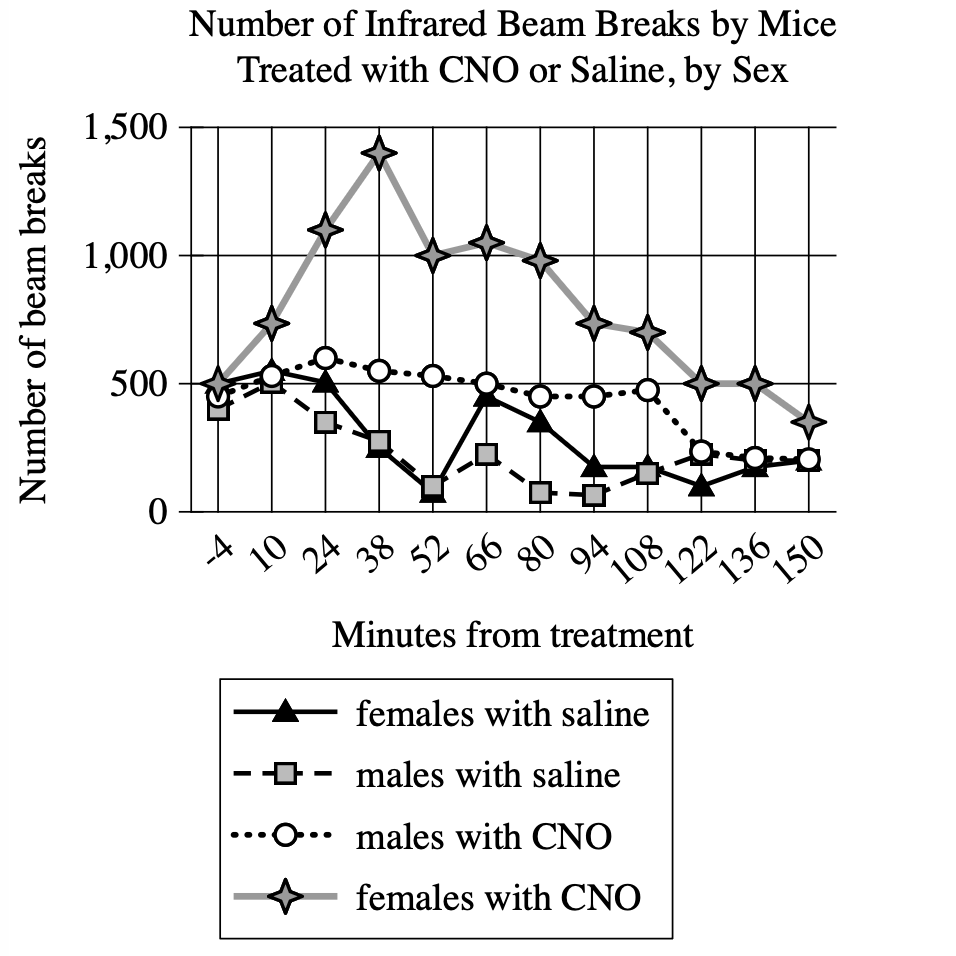
To investigate the influence of certain estrogen-responsive neurons on energy expenditure, biologist Stephanie Correa et al. treated female and male mice with either saline solution or clozapine-N4-oxide (CNO), which activates the neurons. Monitoring the activity levels of the mice by measuring how frequently the animals broke infrared beams crossing their enclosures, Correa et al. found that the mice in their study showed sex-specific differences in response to neuron activation: ______
Which choice most effectively uses data from the graph to complete the assertion?
the four groups of mice differed greatly in their activity levels before treatment but showed identical activity levels at the end of the monitoring period.
saline-treated females showed substantially more activity at certain points in the monitoring period than saline-treated males did.
CNO-treated females showed more activity relative to saline-treated females than CNO-treated males showed relative to saline-treated males.
CNO-treated females showed a substantial increase and then decline in activity over the monitoring period, whereas CNO-treated males showed a substantial decline in activity followed by a steep increase.
Step 1: Decode and Map All Source Material
Part A: Passage Analysis Table
| Text from Passage | Analysis |
|---|---|
| "To investigate the influence of certain estrogen-responsive neurons on energy expenditure, biologist Stephanie Correa et al. treated female and male mice with either saline solution or clozapine-N4-oxide (CNO), which activates the neurons." |
|
| "Monitoring the activity levels of the mice by measuring how frequently the animals broke infrared beams crossing their enclosures, Correa et al. found that the mice in their study showed sex-specific differences in response to neuron activation:" |
|
Visual Data Analysis
Visual Type & Title: Line graph - "Number of Infrared Beam Breaks by Mice Treated with CNO or Saline, by Sex"
What It Shows:
- X-axis: Minutes from treatment (4→150)
- Y-axis: Beam breaks (0→1500)
- 4 groups tracked over time:
- Female + saline (triangle, solid)
- Male + saline (square, dashed)
- Male + CNO (circle, dotted)
- Female + CNO (star, solid gray)
Key Observations:
- Female CNO: dramatic spike around 28min (up to 1400), then decline
- Male CNO: stable around 500-600 throughout
- Both saline groups: gradual decline over time
- CNO effect: Females much stronger than Males
Connection to Text: Graph provides specific data showing the "sex-specific differences in response to neuron activation" mentioned in passage.
Part B: Passage Architecture & Core Elements
Main Point: Correa et al. discovered that male and female mice respond differently to neuron activation, as measured by their activity levels.
Argument Flow: The passage establishes an experimental study design testing neuron activation effects on energy expenditure, then reveals that the response varies significantly between male and female mice.
Text-Visual Synthesis: The text previews "sex-specific differences" while the graph quantifies these differences precisely—showing CNO causes dramatic activity increases in females (peaking at around 1400 beam breaks) but minimal changes in males (staying around 500-600 beam breaks).
Step 2: Interpret the Question Precisely
This is a fill-in-the-blank question asking us to choose the best logical connector. The answer must create the right relationship between what comes before and after the blank.
Step 3: Prethink the Answer
- Must accurately describe sex-specific differences shown in the graph
- Should reference how males vs. females responded to CNO treatment
- Key pattern from graph: CNO had dramatically stronger effects on females (huge spike to around 1400) than on males (stayed around 500-600)
- Could compare CNO groups directly, or compare CNO effects relative to each sex's control group
- Right answer should describe how CNO treatment affected females much more dramatically than males, either through direct comparison or by showing the treatment had stronger effects relative to controls in females
the four groups of mice differed greatly in their activity levels before treatment but showed identical activity levels at the end of the monitoring period.
- Claims groups "differed greatly...before treatment" but graph shows all starting around 500
- Claims "identical activity levels at the end" but graph shows different final levels
- Contradicts visual data on both counts
saline-treated females showed substantially more activity at certain points in the monitoring period than saline-treated males did.
- Claims saline-treated females showed "substantially more activity" than saline-treated males
- Graph shows both saline groups follow similar declining patterns
- No substantial difference between the two saline lines visible
CNO-treated females showed more activity relative to saline-treated females than CNO-treated males showed relative to saline-treated males.
- Compares CNO effects relative to each sex's control group
- Females: CNO group peaks at around 1400 vs saline group starting around 500 and declining = massive difference
- Males: CNO group stays around 500-600 vs saline group declining from around 500 = modest difference
- Accurately captures that CNO had proportionally stronger effects in females than males
CNO-treated females showed a substantial increase and then decline in activity over the monitoring period, whereas CNO-treated males showed a substantial decline in activity followed by a steep increase.
- First part accurate (CNO females: increase then decline)
- Second part wrong: CNO males show stable activity, not "substantial decline followed by steep increase"
- Graph shows CNO males maintaining around 500-600 throughout, with no dramatic decline-then-increase pattern