When magma moves underneath a volcano, it causes the surface of the volcano to change. This is known as deformation....
GMAT Information and Ideas : (Ideas) Questions
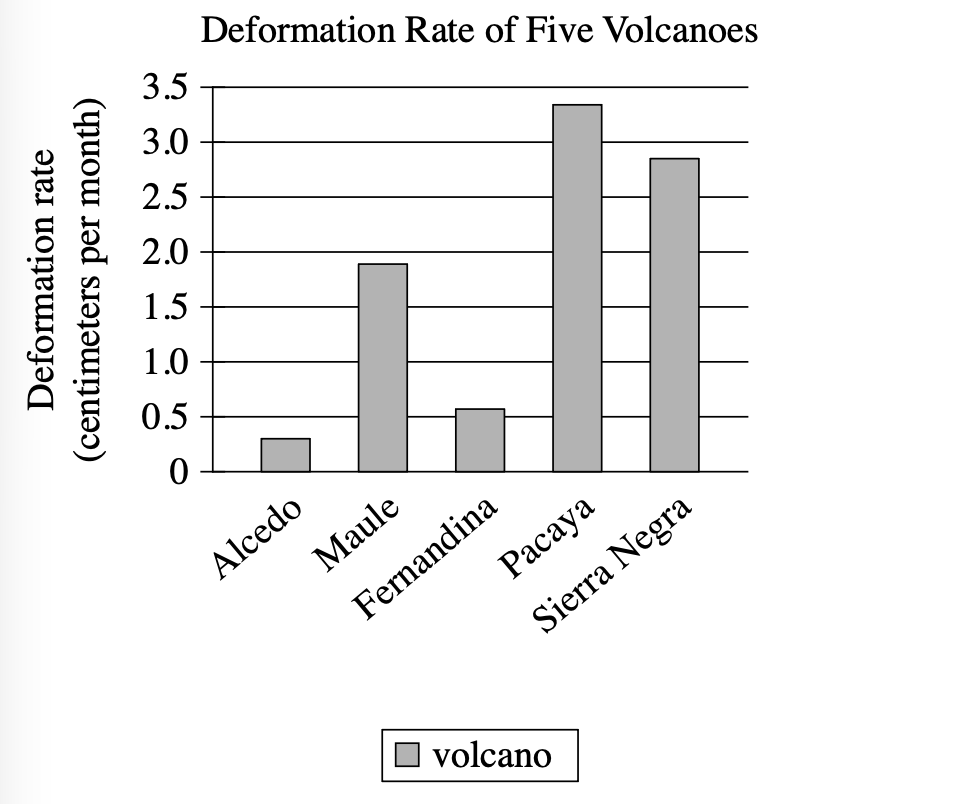
When magma moves underneath a volcano, it causes the surface of the volcano to change. This is known as deformation. Researchers recently calculated the amount of deformation occurring each month for five volcanoes in Latin America. Although Sierra Negra experienced a lot of deformation, its deformation rate was still lower than that of ______
Which choice most effectively uses data from the graph to complete the statement?
Alcedo
Pacaya
Fernandina
Maule
Step 1: Decode and Map All Source Material
Passage Analysis Table
| Text from Passage | Analysis |
|---|---|
| "When magma moves underneath a volcano, it causes the surface of the volcano to change." |
|
| "This is known as deformation." |
|
| "Researchers recently calculated the amount of deformation occurring each month for five volcanoes in Latin America." |
|
| "Although Sierra Negra experienced a lot of deformation, its deformation rate was still lower than that of ______" |
|
Visual Data Analysis
Visual Type & Title: Bar chart - "Deformation Rate of Five Volcanoes"
What It Shows: Y-axis shows deformation rate in centimeters per month, X-axis shows 5 volcanoes. Scale goes from 0 to 3.5 cm/month. Data points: Alcedo approximately 0.3, Maule approximately 1.9, Fernandina approximately 0.6, Pacaya approximately 3.3, Sierra Negra approximately 2.9.
Key Observations: Pacaya has the highest rate at 3.3 cm/month. Sierra Negra is second highest at 2.9 cm/month. Only Pacaya exceeds Sierra Negra's rate.
Connection to Text: The graph provides the specific numerical data needed to complete the comparative statement about Sierra Negra's deformation rate.
Passage Architecture & Core Elements
Main Point: Researchers measured monthly deformation rates for five Latin American volcanoes, with Sierra Negra showing high deformation but not the highest rate.
Argument Flow: The passage establishes the scientific concept of volcanic deformation, describes a recent study measuring this phenomenon across five volcanoes, then presents an incomplete comparison about Sierra Negra's relative ranking.
Text-Visual Synthesis: The text provides context about deformation and mentions Sierra Negra's high but not highest rate, while the graph supplies the precise measurements needed to identify which volcano exceeded Sierra Negra's 2.9 cm/month deformation rate.
Step 2: Interpret the Question Precisely
This is a fill-in-the-blank question asking us to choose the best logical connector. The answer must create the right relationship between what comes before and after the blank.
Step 3: Prethink the Answer
- From the graph, Sierra Negra's deformation rate is approximately 2.9 centimeters per month
- The passage tells us Sierra Negra had "a lot of deformation" but its rate was "still lower than" another volcano
- We need to find which volcano shows a rate higher than 2.9 cm/month in the graph
- Looking at the data: Alcedo, Fernandina, and Maule all show lower values, while Pacaya shows approximately 3.3 cm/month - the only rate higher than Sierra Negra's
- So the right answer should identify Pacaya as the volcano with the highest deformation rate, exceeding Sierra Negra's rate
Alcedo
✗ Incorrect
- Alcedo shows the lowest deformation rate at approximately \(0.3\mathrm{\ cm/month}\), much lower than Sierra Negra's \(2.9\mathrm{\ cm/month}\)
Pacaya
✓ Correct
- Pacaya shows the highest deformation rate at approximately \(3.3\mathrm{\ cm/month}\), the only volcano with a rate higher than Sierra Negra's \(2.9\mathrm{\ cm/month}\)
Fernandina
✗ Incorrect
- Fernandina shows approximately \(0.6\mathrm{\ cm/month}\), much lower than Sierra Negra's rate
Maule
✗ Incorrect
- Maule shows approximately \(1.9\mathrm{\ cm/month}\), still lower than Sierra Negra's \(2.9\mathrm{\ cm/month}\) rate